Your First Scope
Let's walk through creating your first scope. You can use the sample data in this guide or use your own data and follow along. To use the sample data you can download this csv of survey questions and answers extracted from the 2022 Data Visualization Society annual survey.
Starting the tool
If you've already installed & configured Latent Scope, you can start the web UI
cd ~/latent-scope-data
ls-serve
and visit http://localhost:5001
The Process
Latent Scope takes you through a five step process resulting in what we call a "scope". A scope contains all the relevant data needed to visualize and curate your dataset using embeddings. Each step in this process feeds into the next, this guide will walk you through the basics of the process so you can try it on your own data.

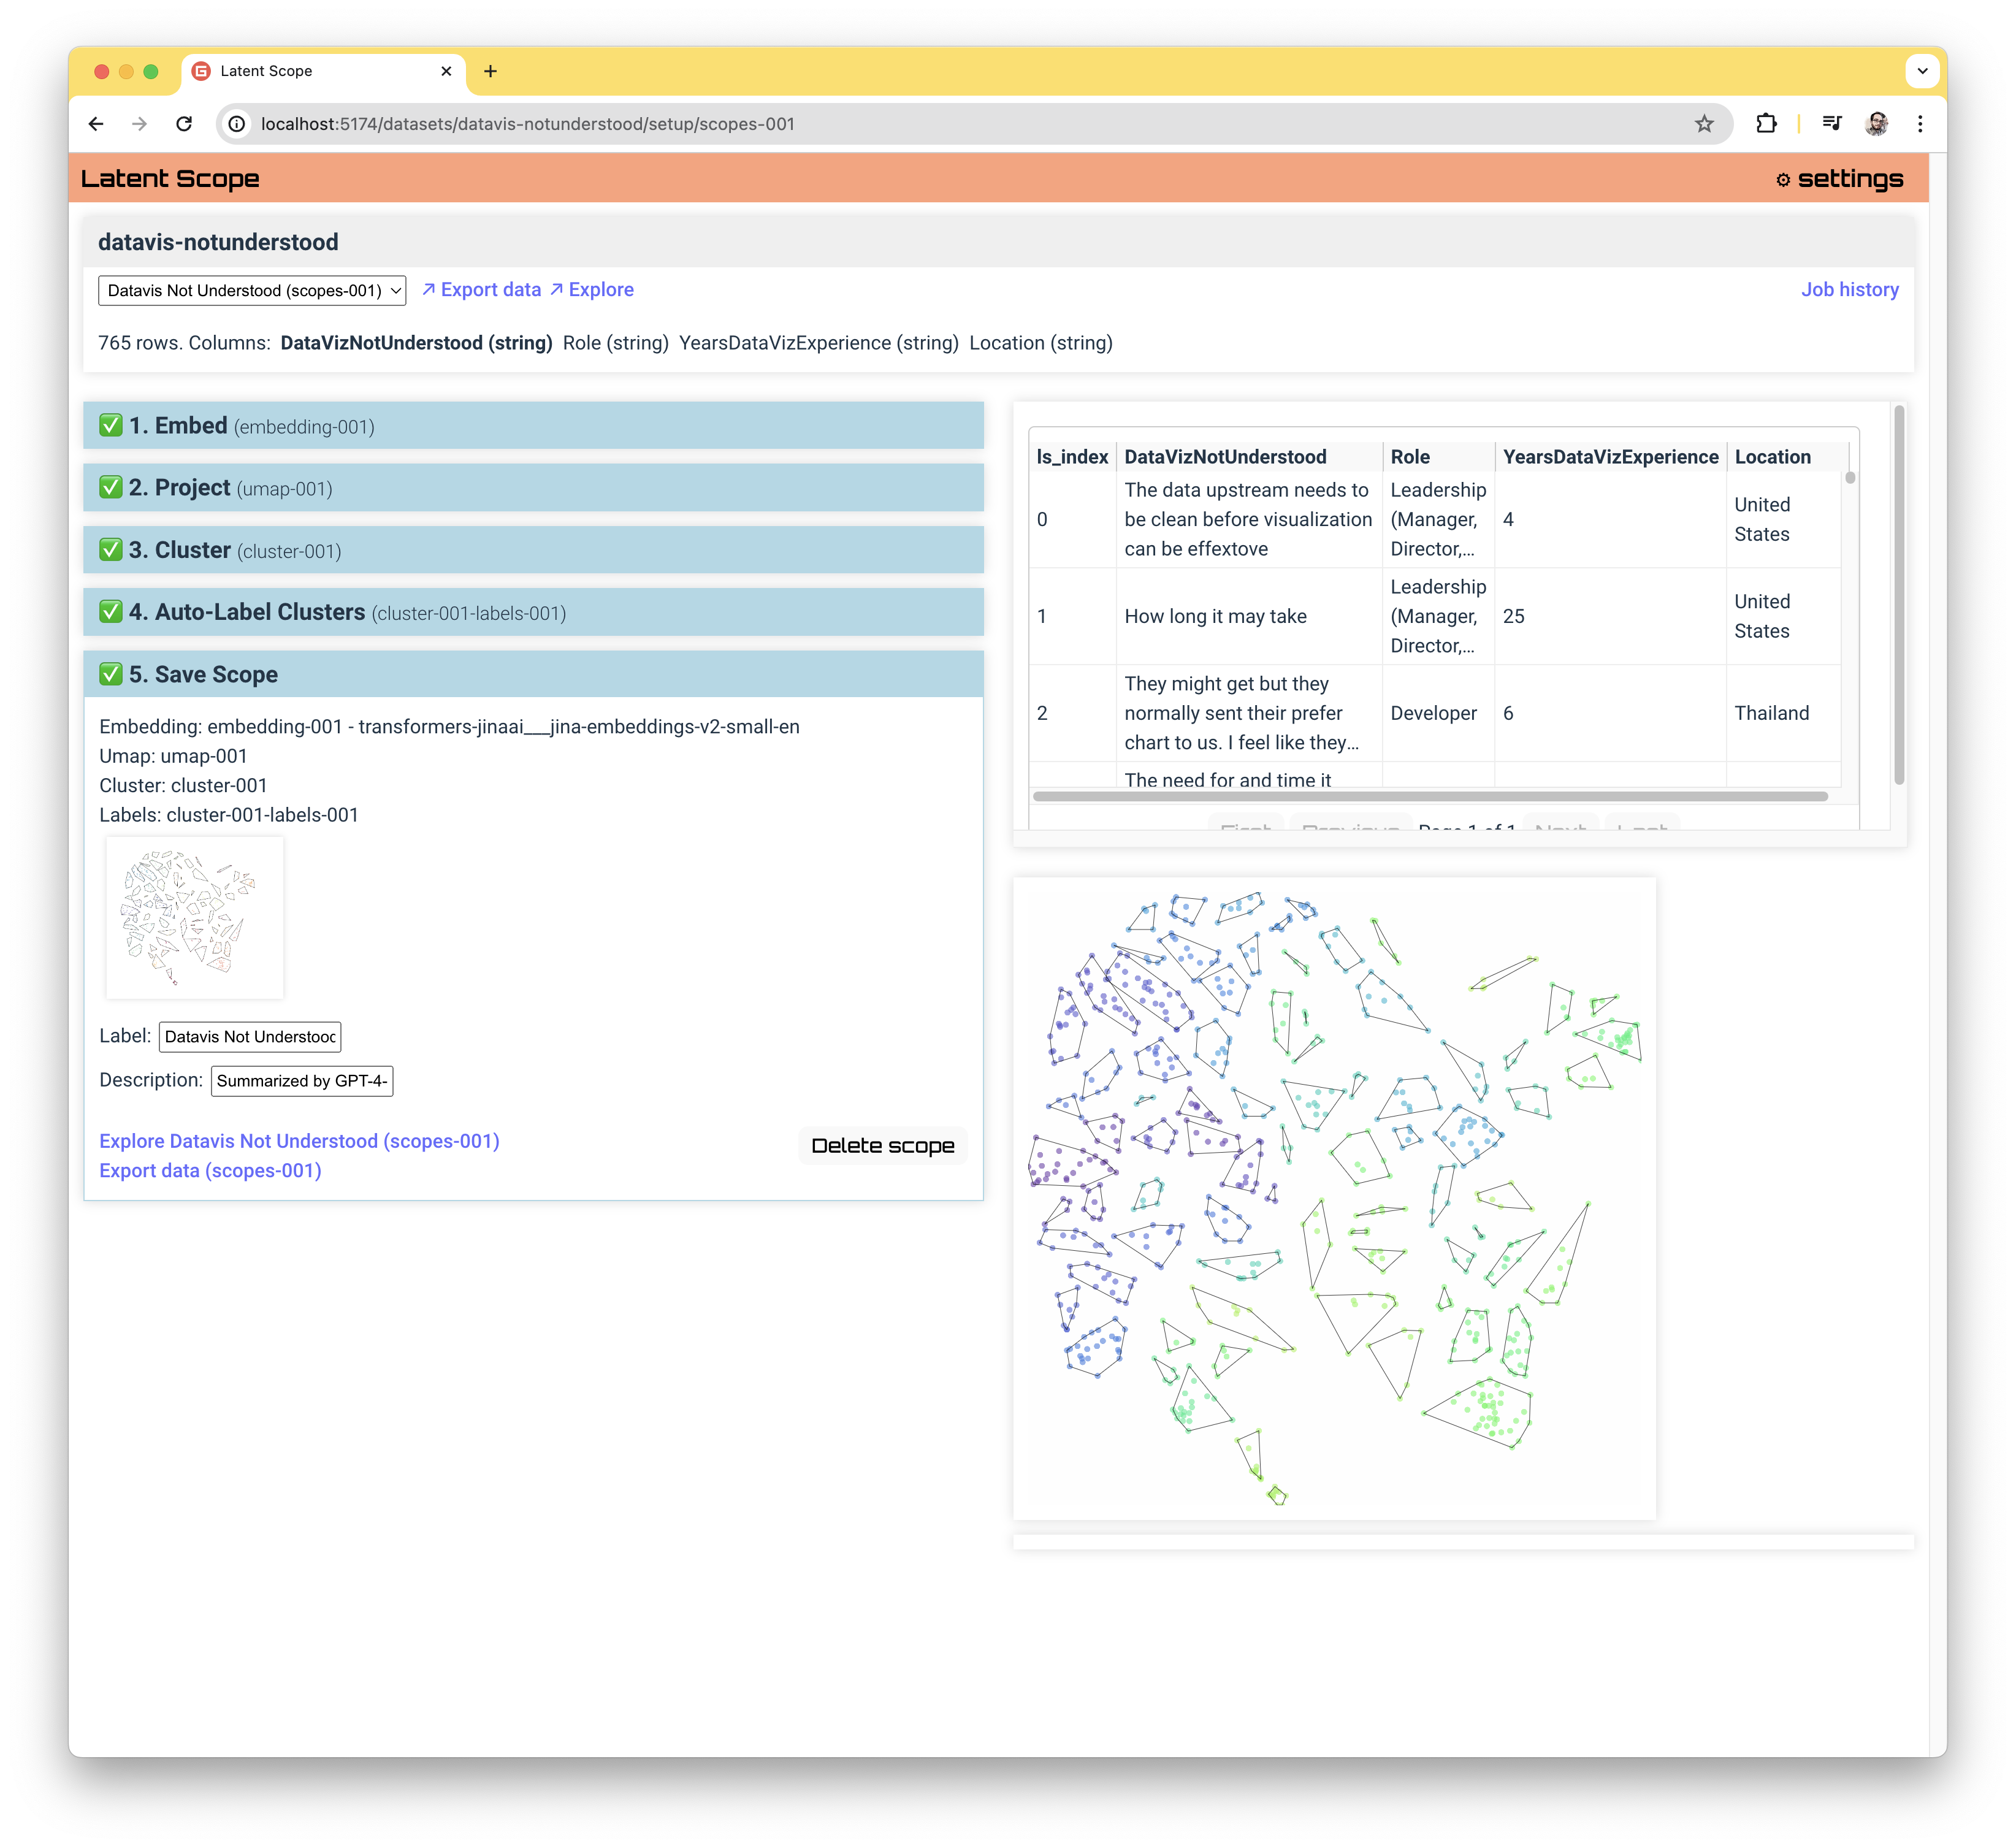
At the end of the process you will see something like this, with your data ready to explore, curate and export:
Uploading your data
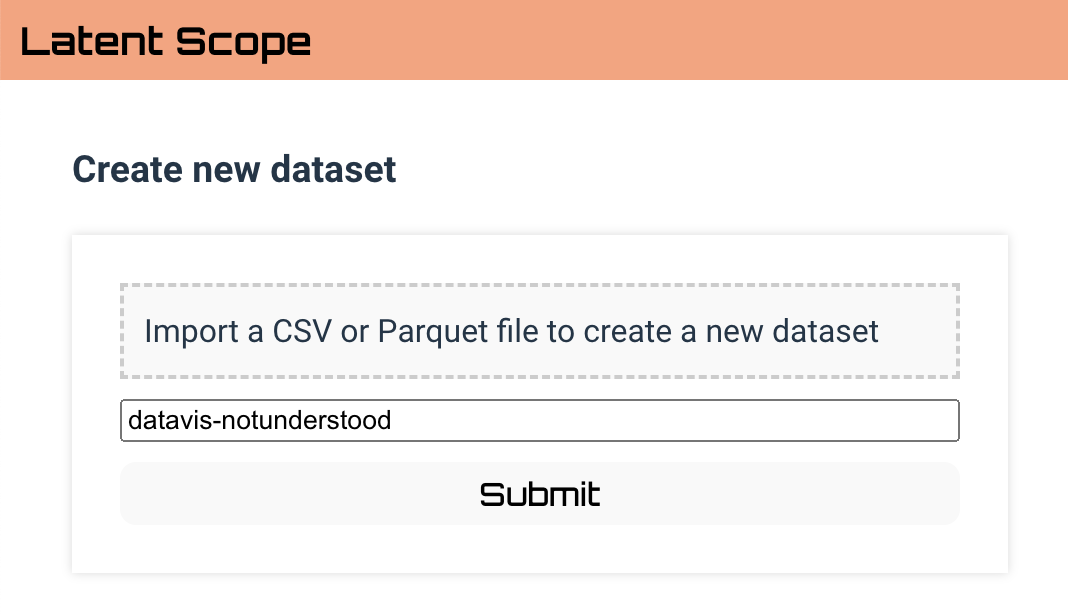
The first thing you'll want to do is drop your data into the upload file box on the homepage. This will prompt you to choose a name for your project, which will essentially be a folder where the input data and all subsequent processed data will be stored. You can also see examples of using Python notebooks to ingest larger data files directly from Python in the github repository.
Embed
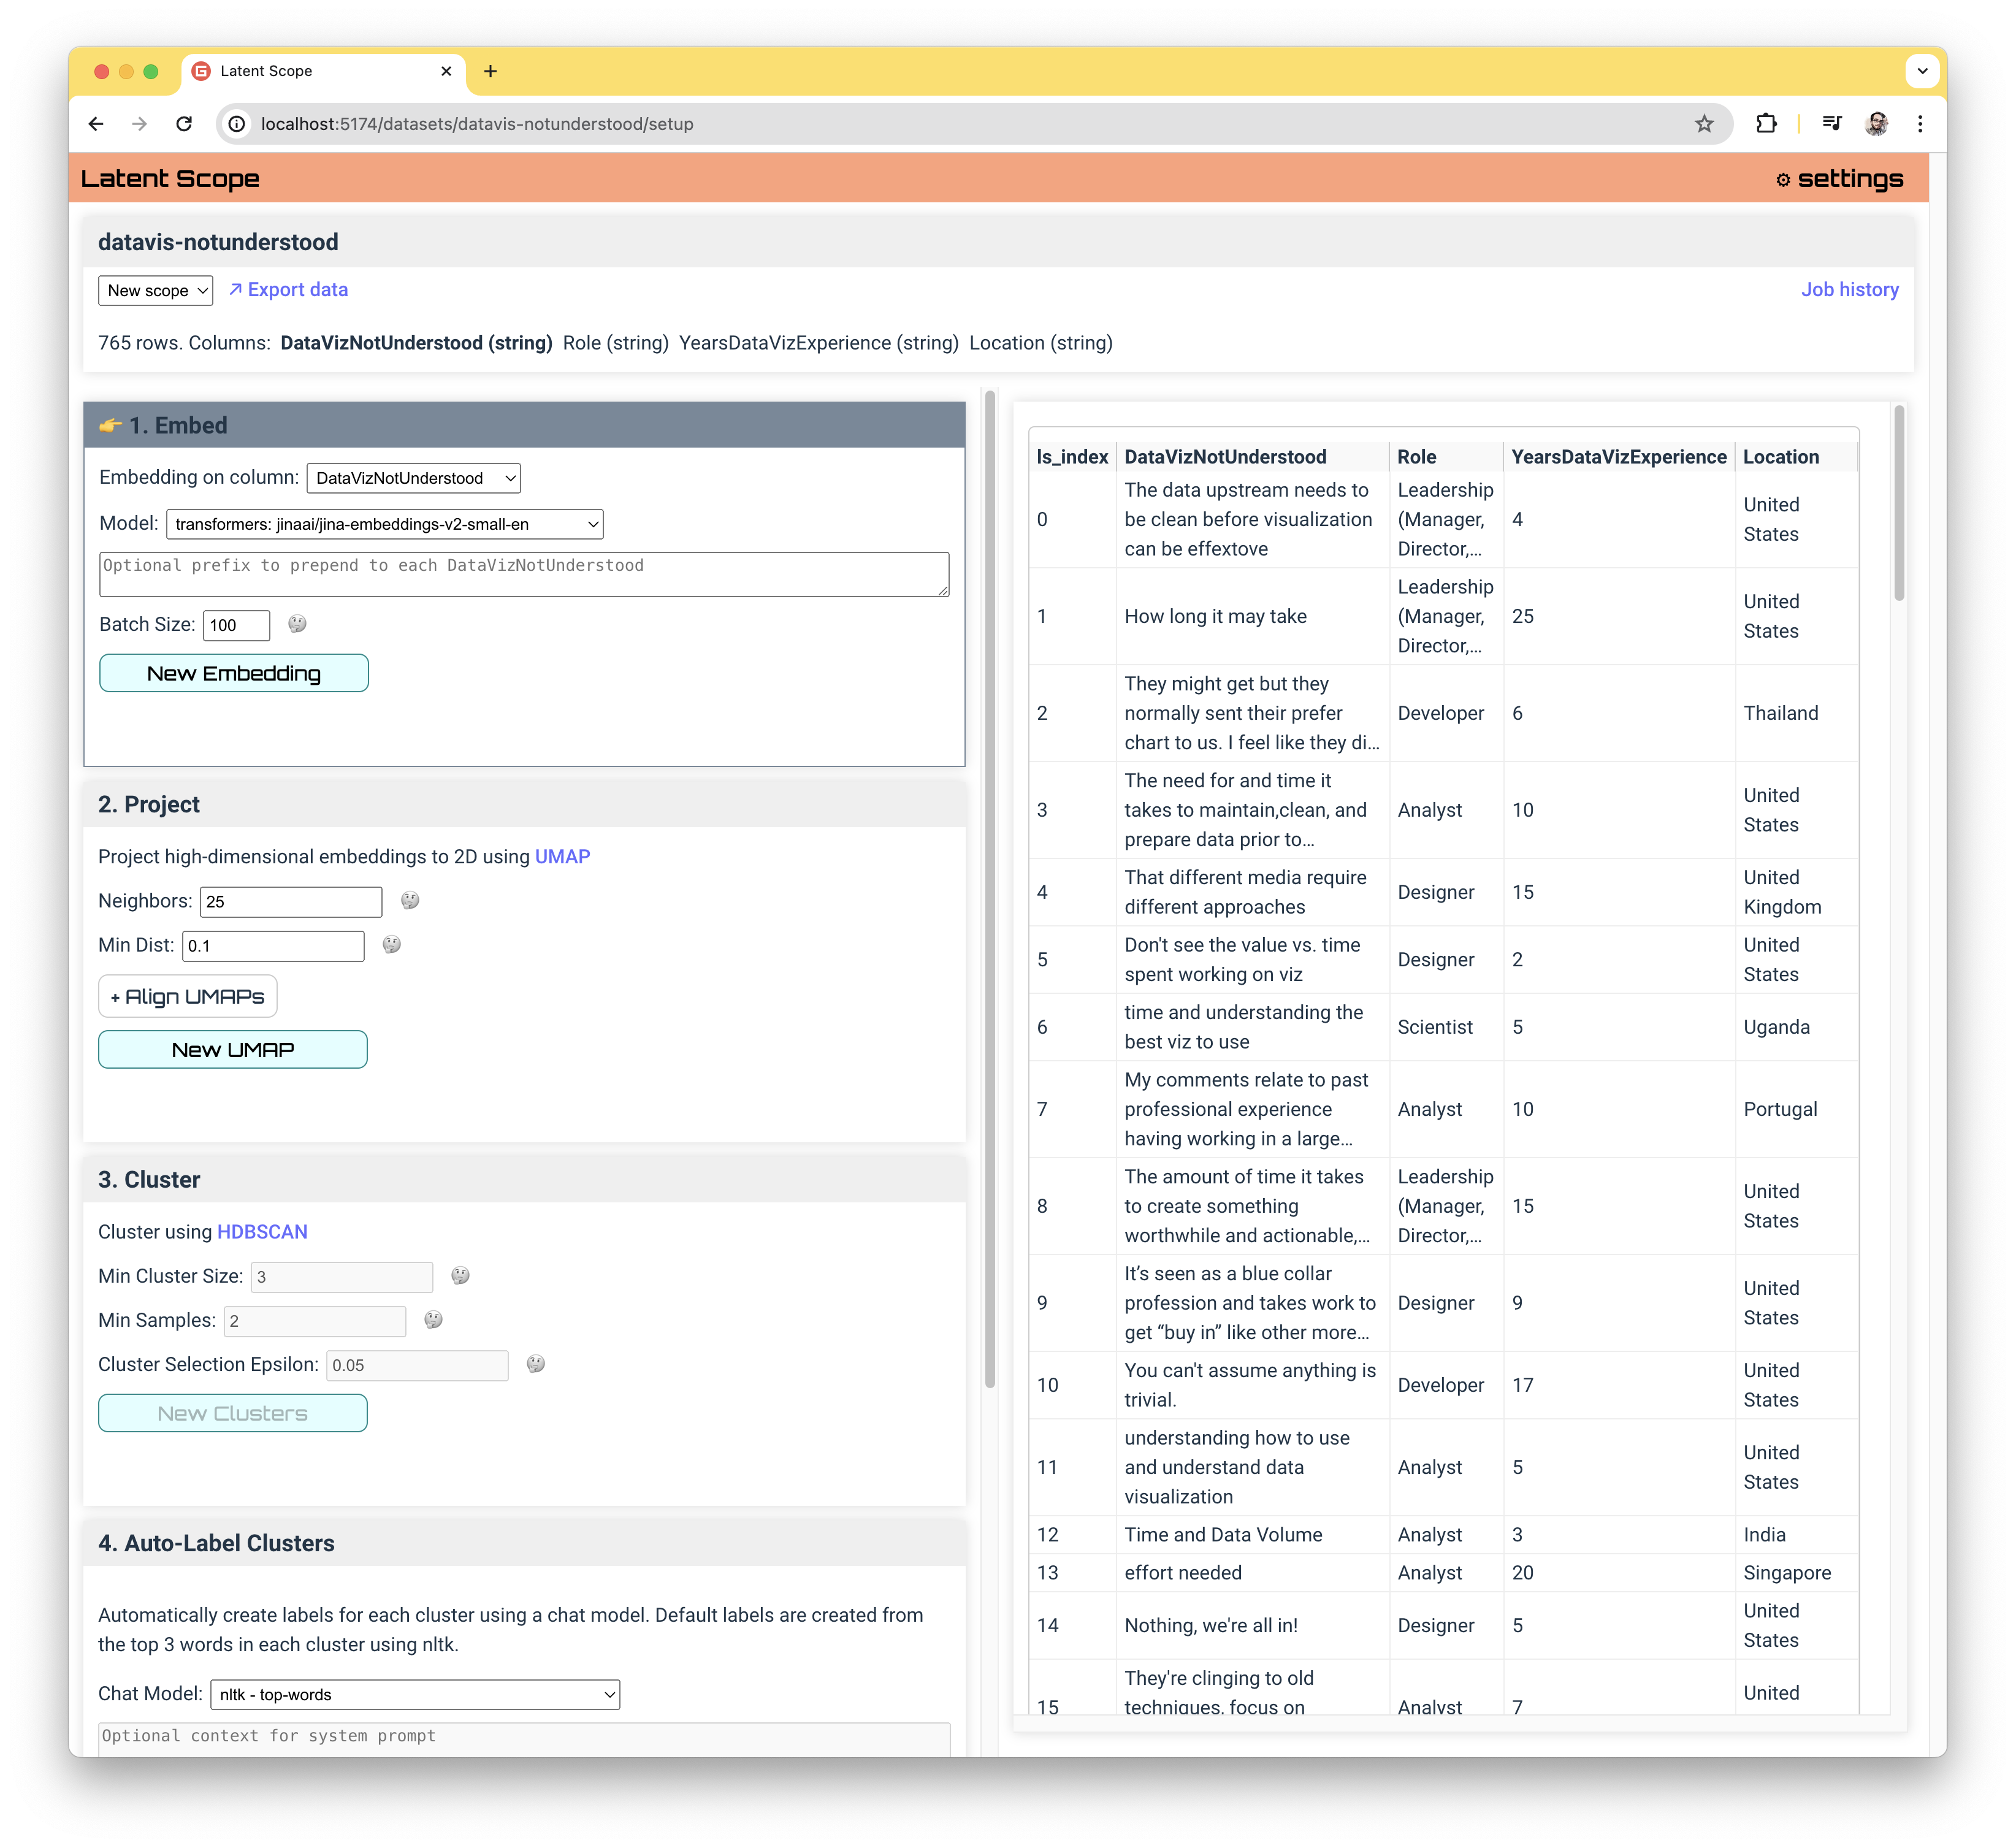
The first step in the process is embedding your data. Immediately after uploading your data you will be taken to the "Setup" page to begin the process. There will be quite a lot on the screen: The top panel shows some information about the dataset including the inferred types of each column, The left column contains the panels for each step of the process and the right column contains a table view of a sample of the dataset.
Let's take a closer look at the options available in the first step:
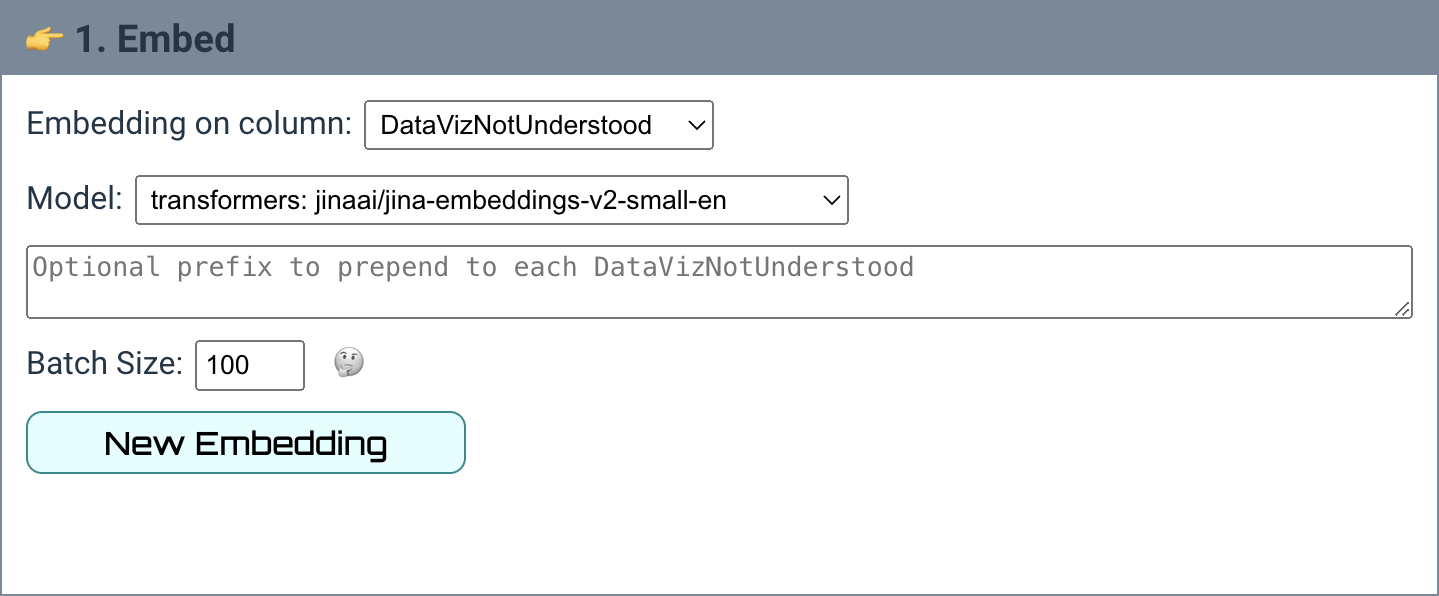
The most important choice is Embedding on column which determines which field you want to use to embed your data. This should be a text field that you want to explore, typically it will be unstructured.
The Optional Prefix allows you to prepend text to each piece of text being embedded, which some embedding models encourage (i.e "Document for retrieval:"). The Batch Size is how many text entries are being processed at once, reducing this can save memory if running locally but will make the process take longer.
The next most important choice is the model:
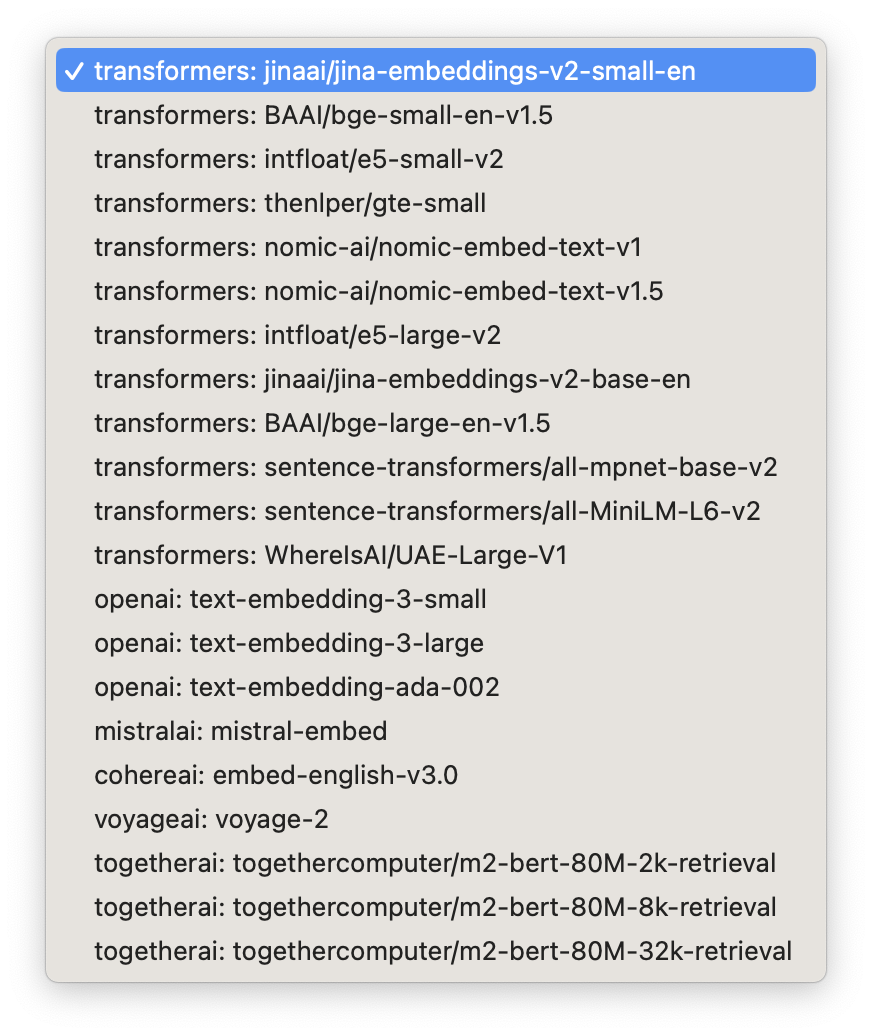
We currently support a number of open source models via the HuggingFace transformers library (with plans for more) as well as proprietary API models from providers like OpenAI, Mistral, Cohere and Voyage.
When you click New Embedding the tool will run the command for calculating the embeddings on the column you've chosen.
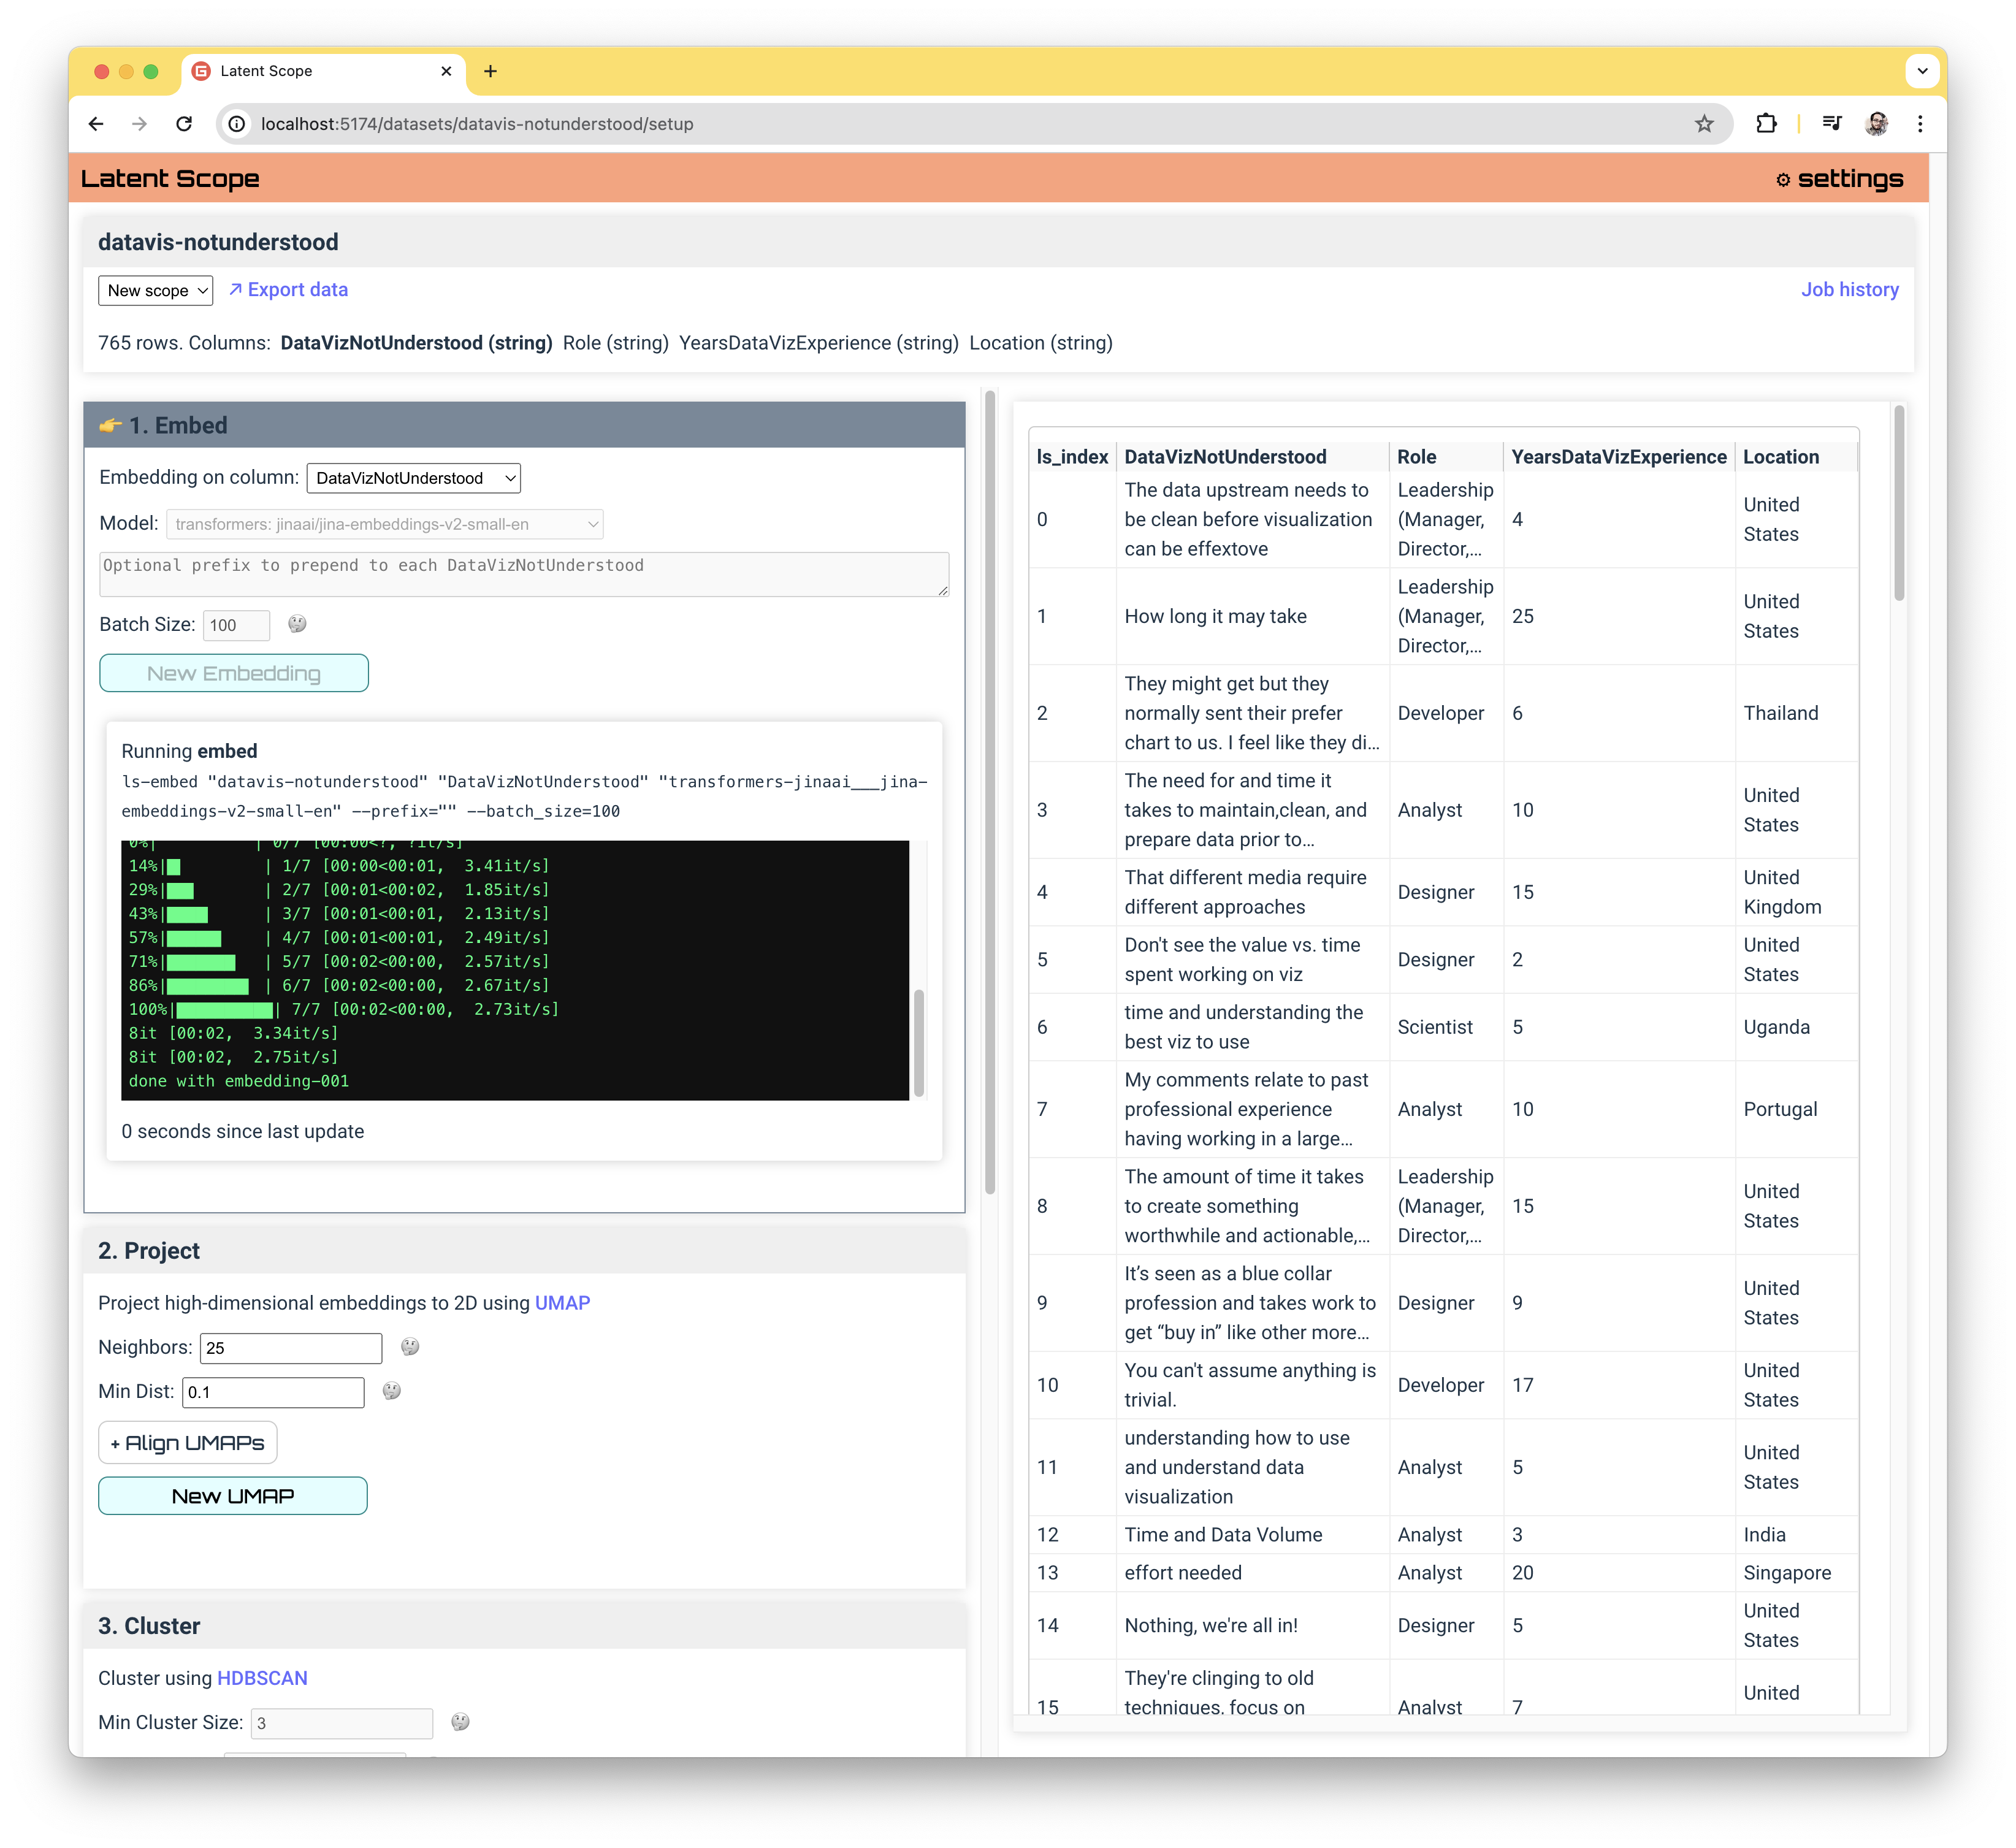
Note the progress display is showing the actual output of the command line command being run by Latent Scope.
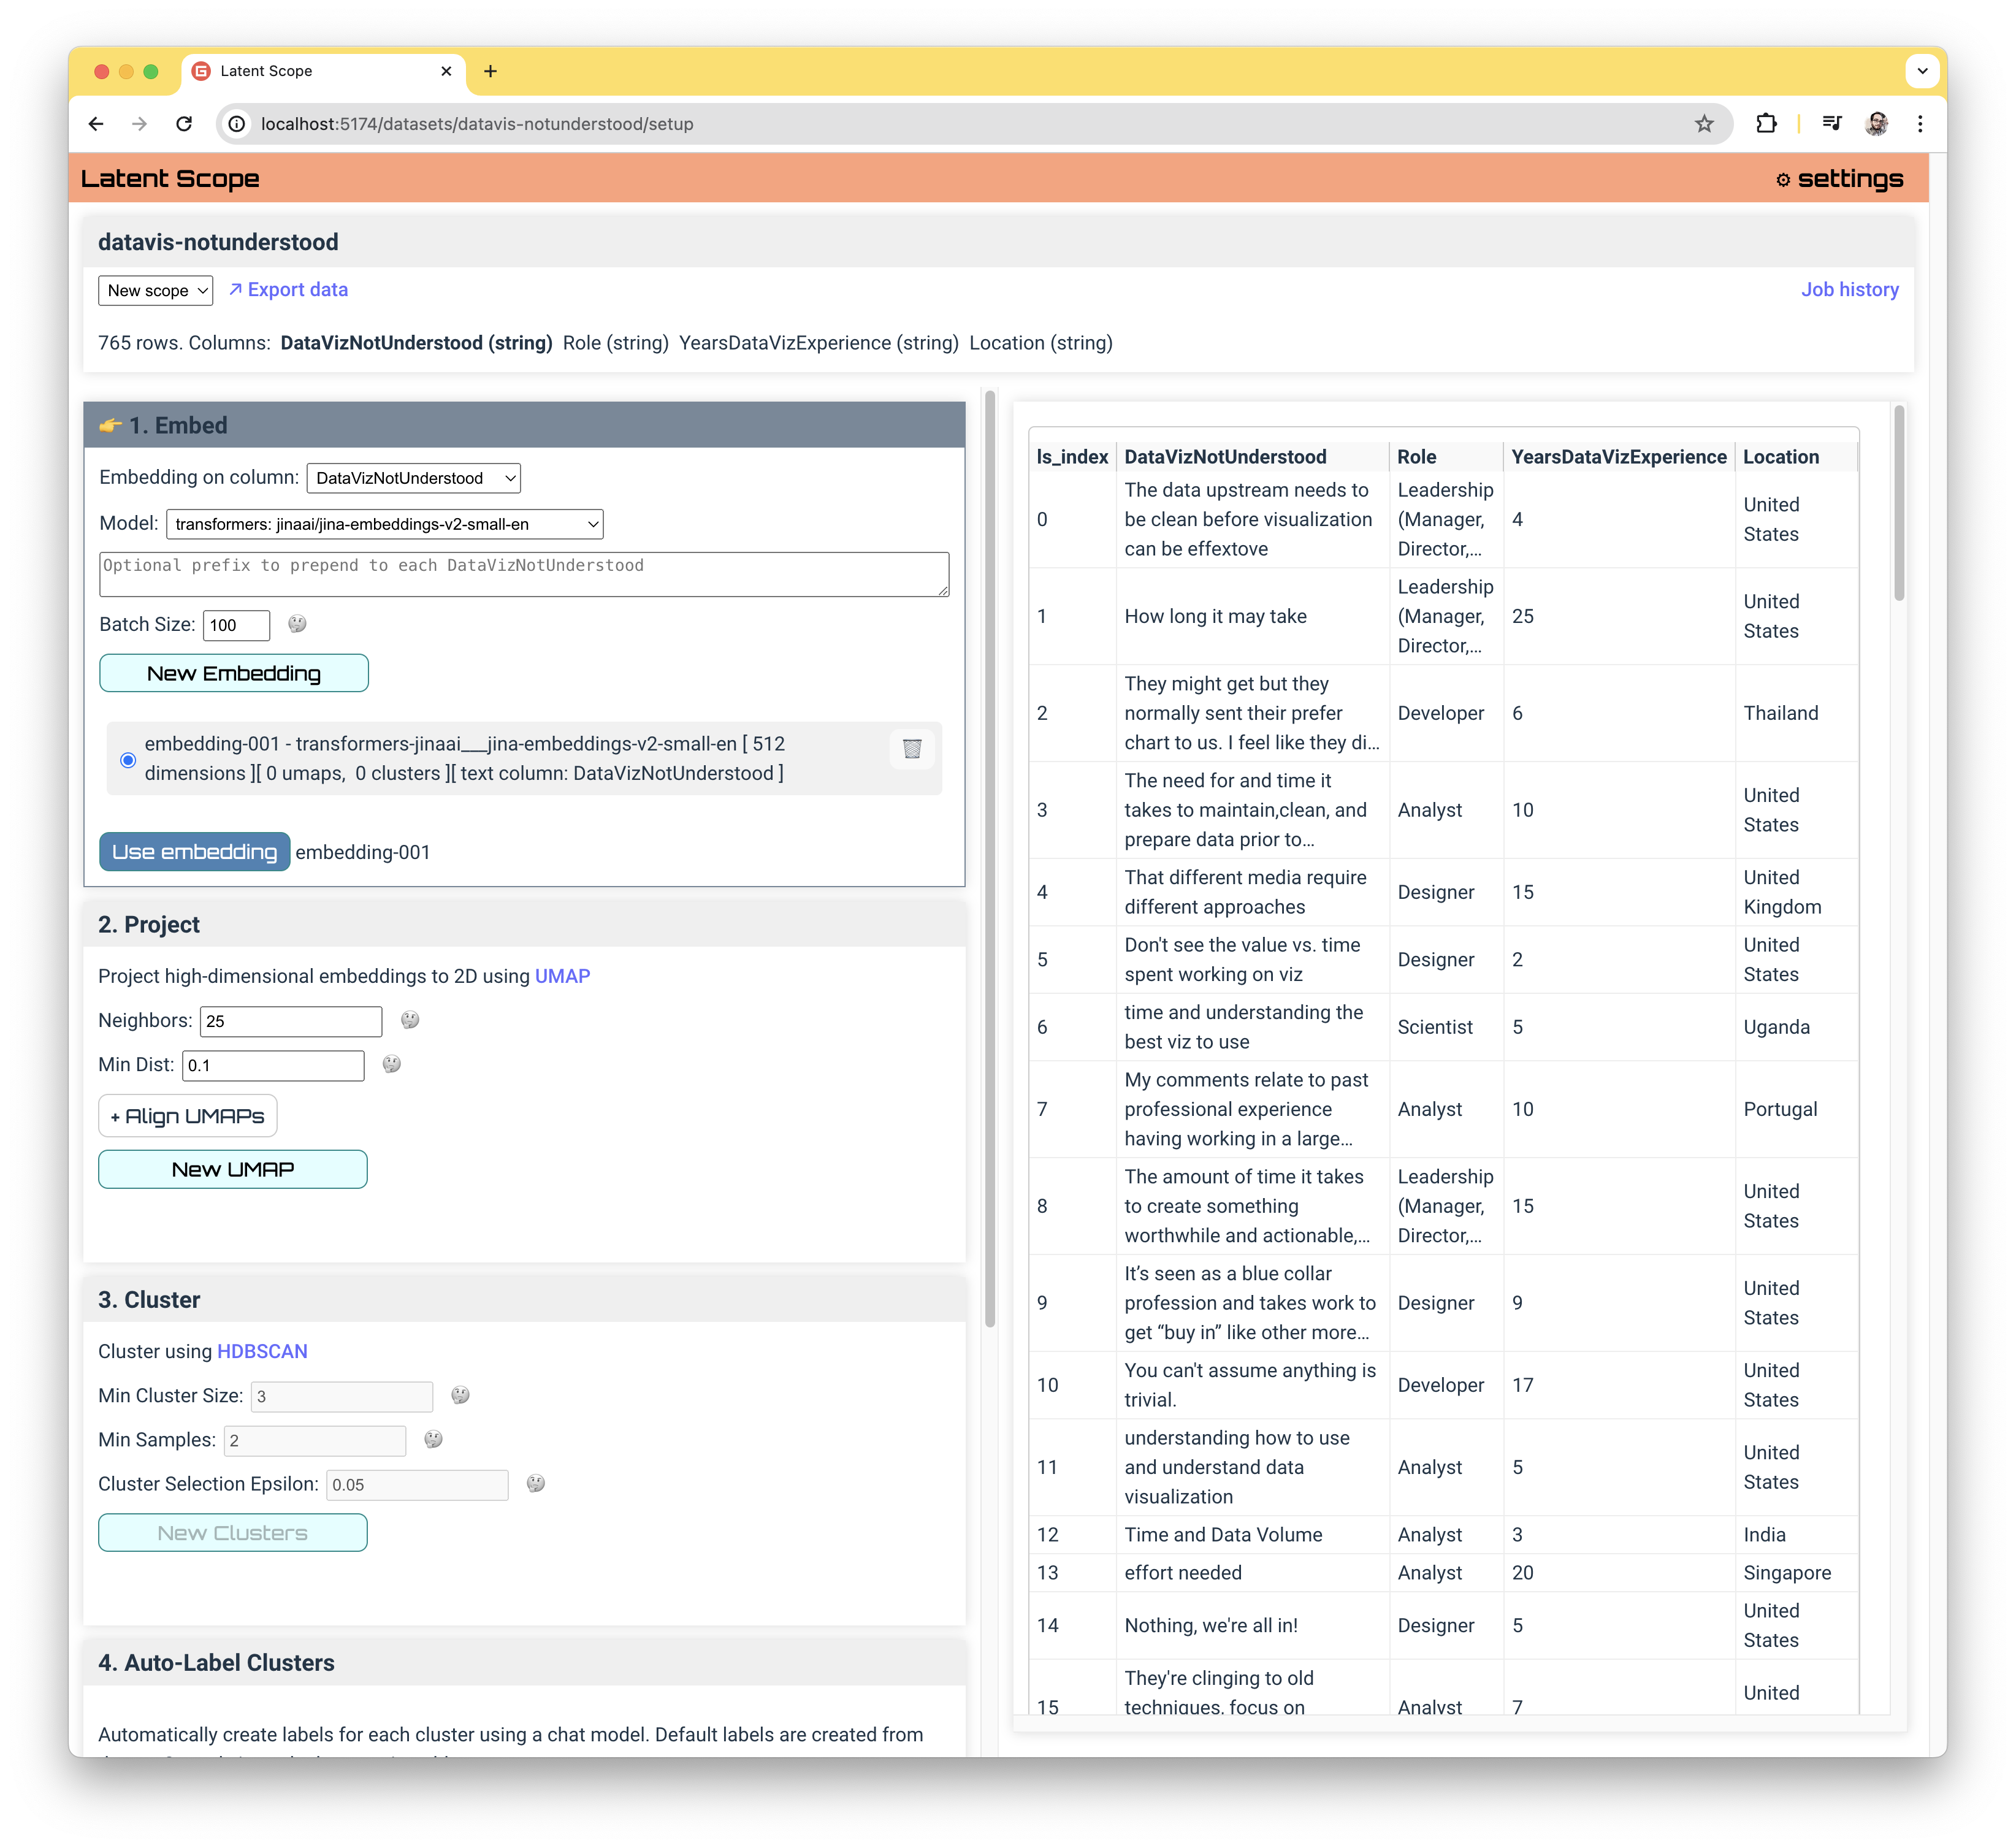
When the embedding command is complete, you can select the new embedding via the Use Embedding button. In later steps you may decide you want to try a different embedding, in which case you would return to this step and generate another one to use.
Project
Once you've chosen your embedding, the next step is projecting the high-dimensional vectors to 2D points for use in clustering and visualization. We use UMAP to do this projection.
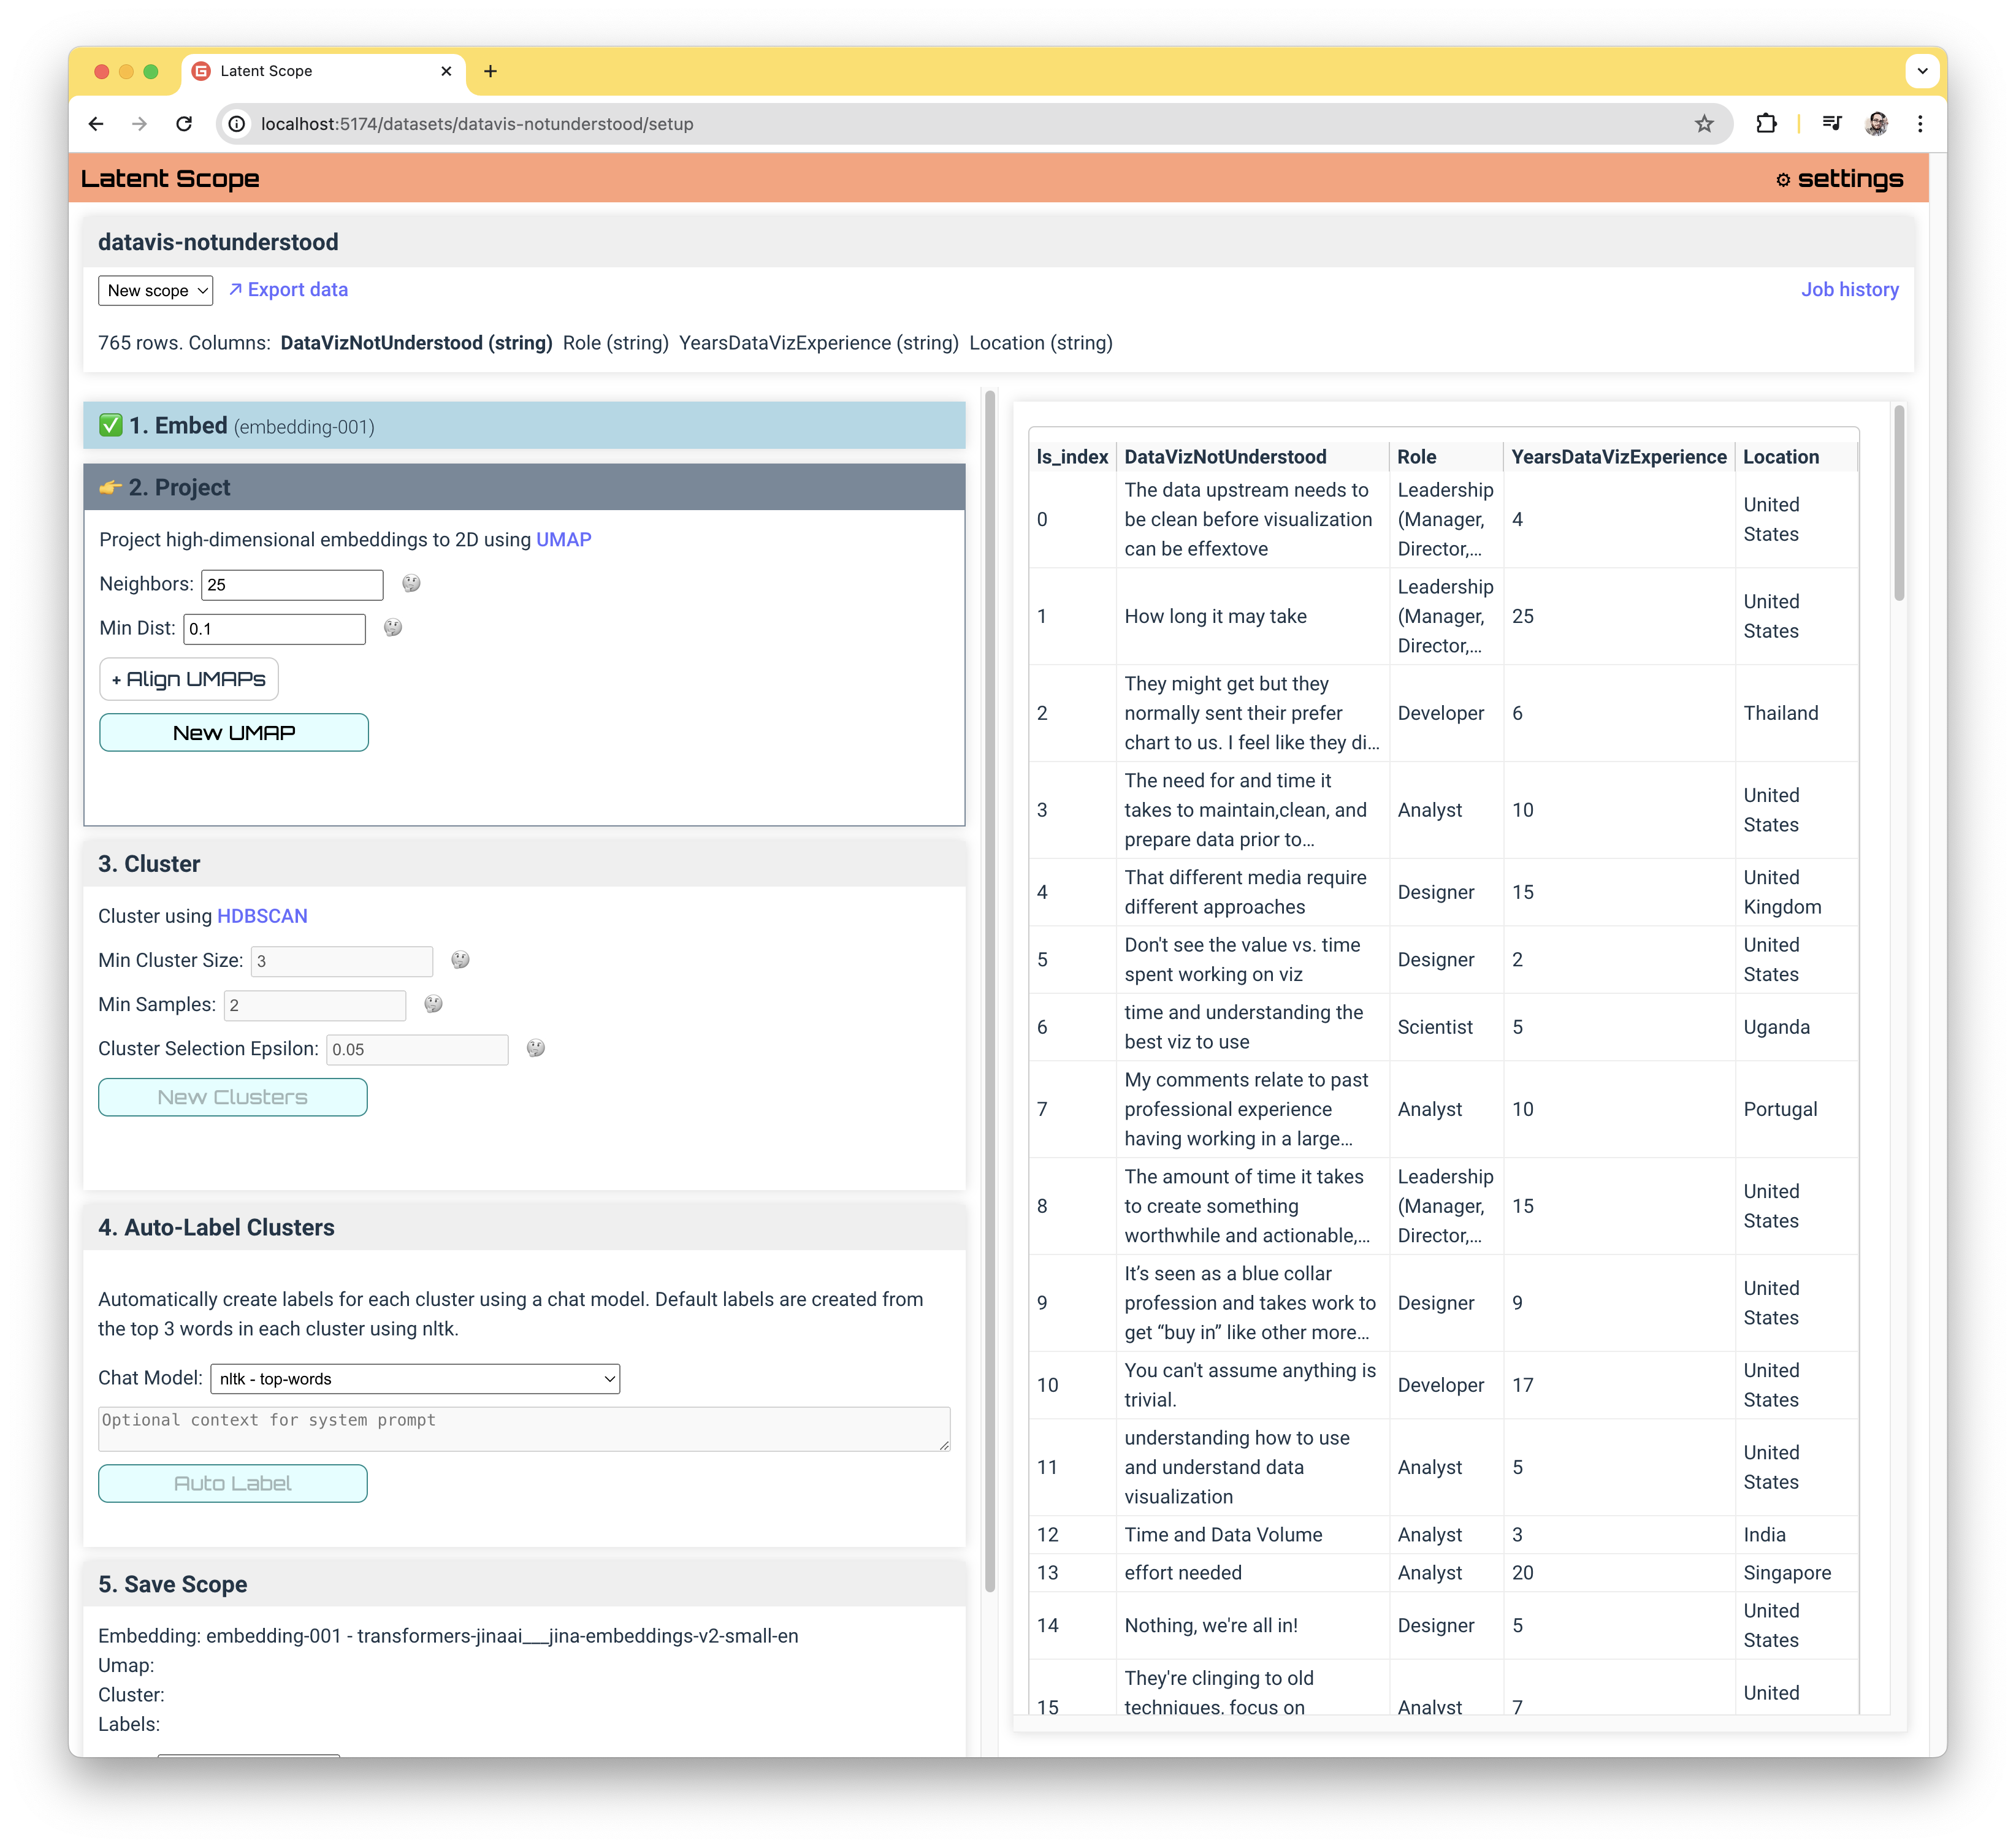
There are a couple of choices, which are set to default values based on the number of data points in your dataset. Setting the Neighbors parameter higher will preserve more global information but also take longer. Setting the Min Dist parameter higher will effectively spread out the points, which may make clustering less effective.
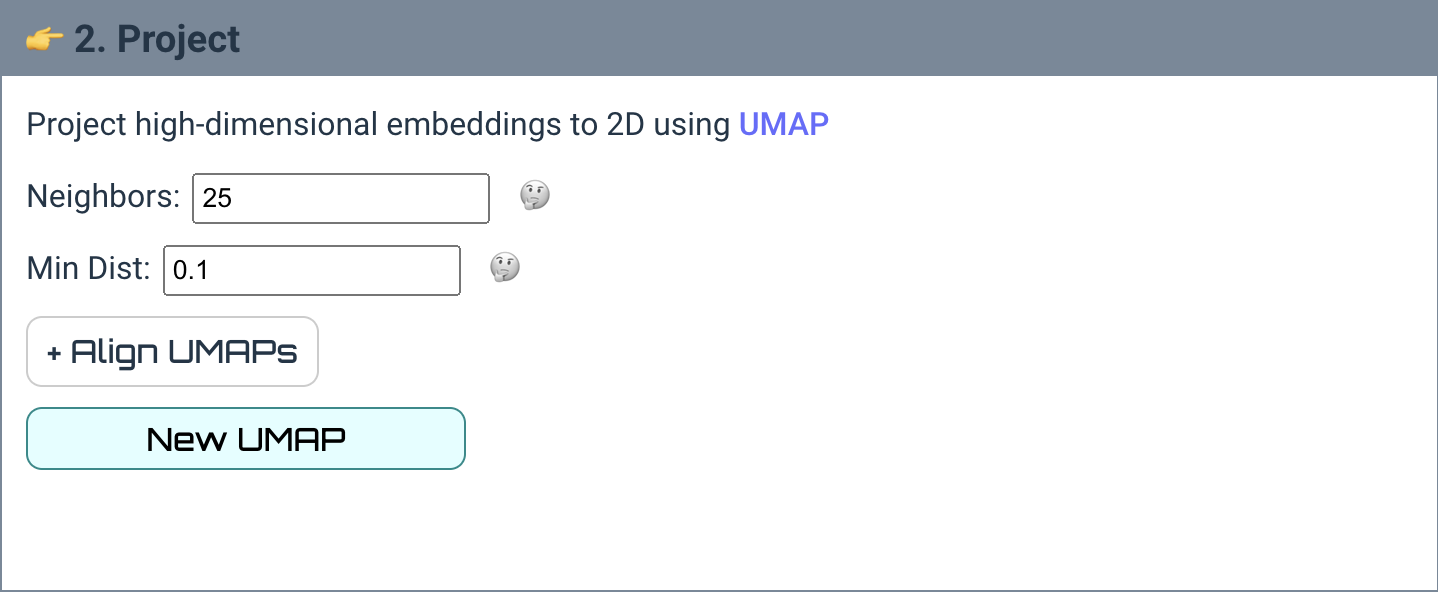
The +Align UMAPs button is an advanced option that can be used to generate UMAPs that consider multiple embeddings at one time, which will be explained in more detail in a future tutorial.
You may find yourself trying UMAP with several different parameter choices to get a projection that looks suitable. Once you're happy (enough) click Use UMAP to progress to the next step!
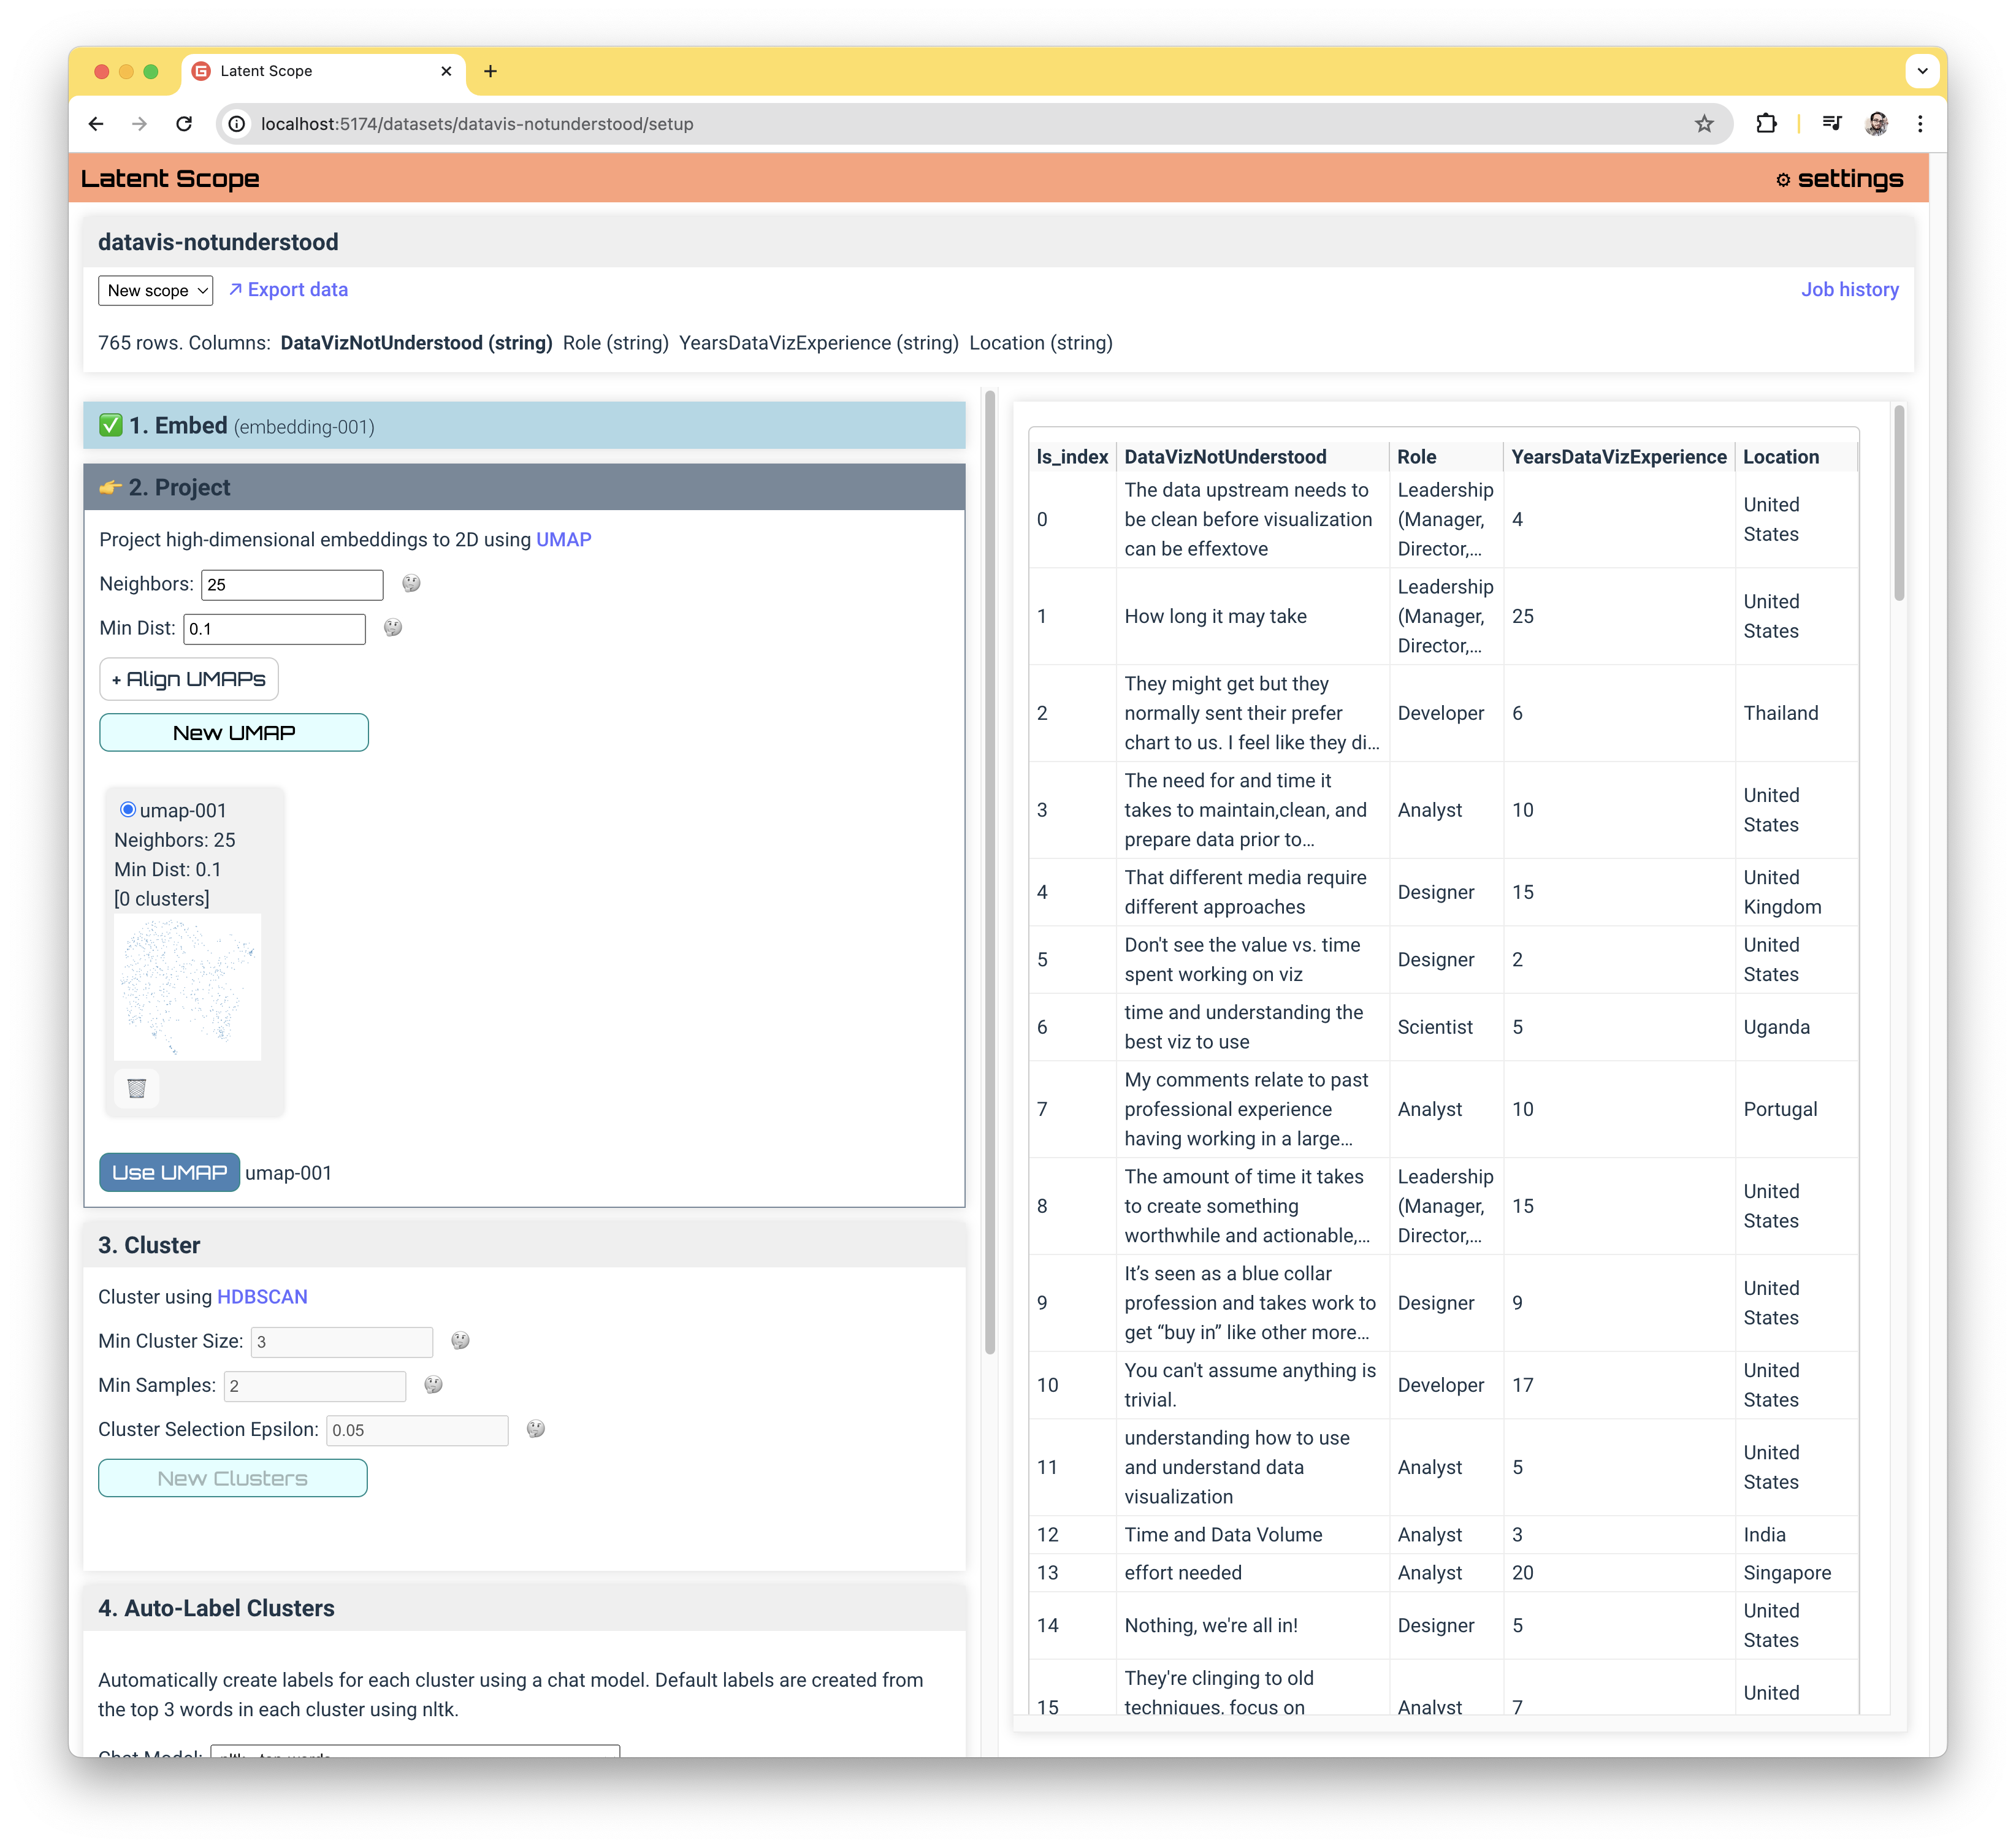
An important philosophy behind Latent Scope is that each step tends to be more of an experiment than a certain choice. Often times when progressing through the steps we want to go back and try different choices. Latent Scope was designed to make it easy to keep track of your experimentations and allow you to easily select from them.
Cluster
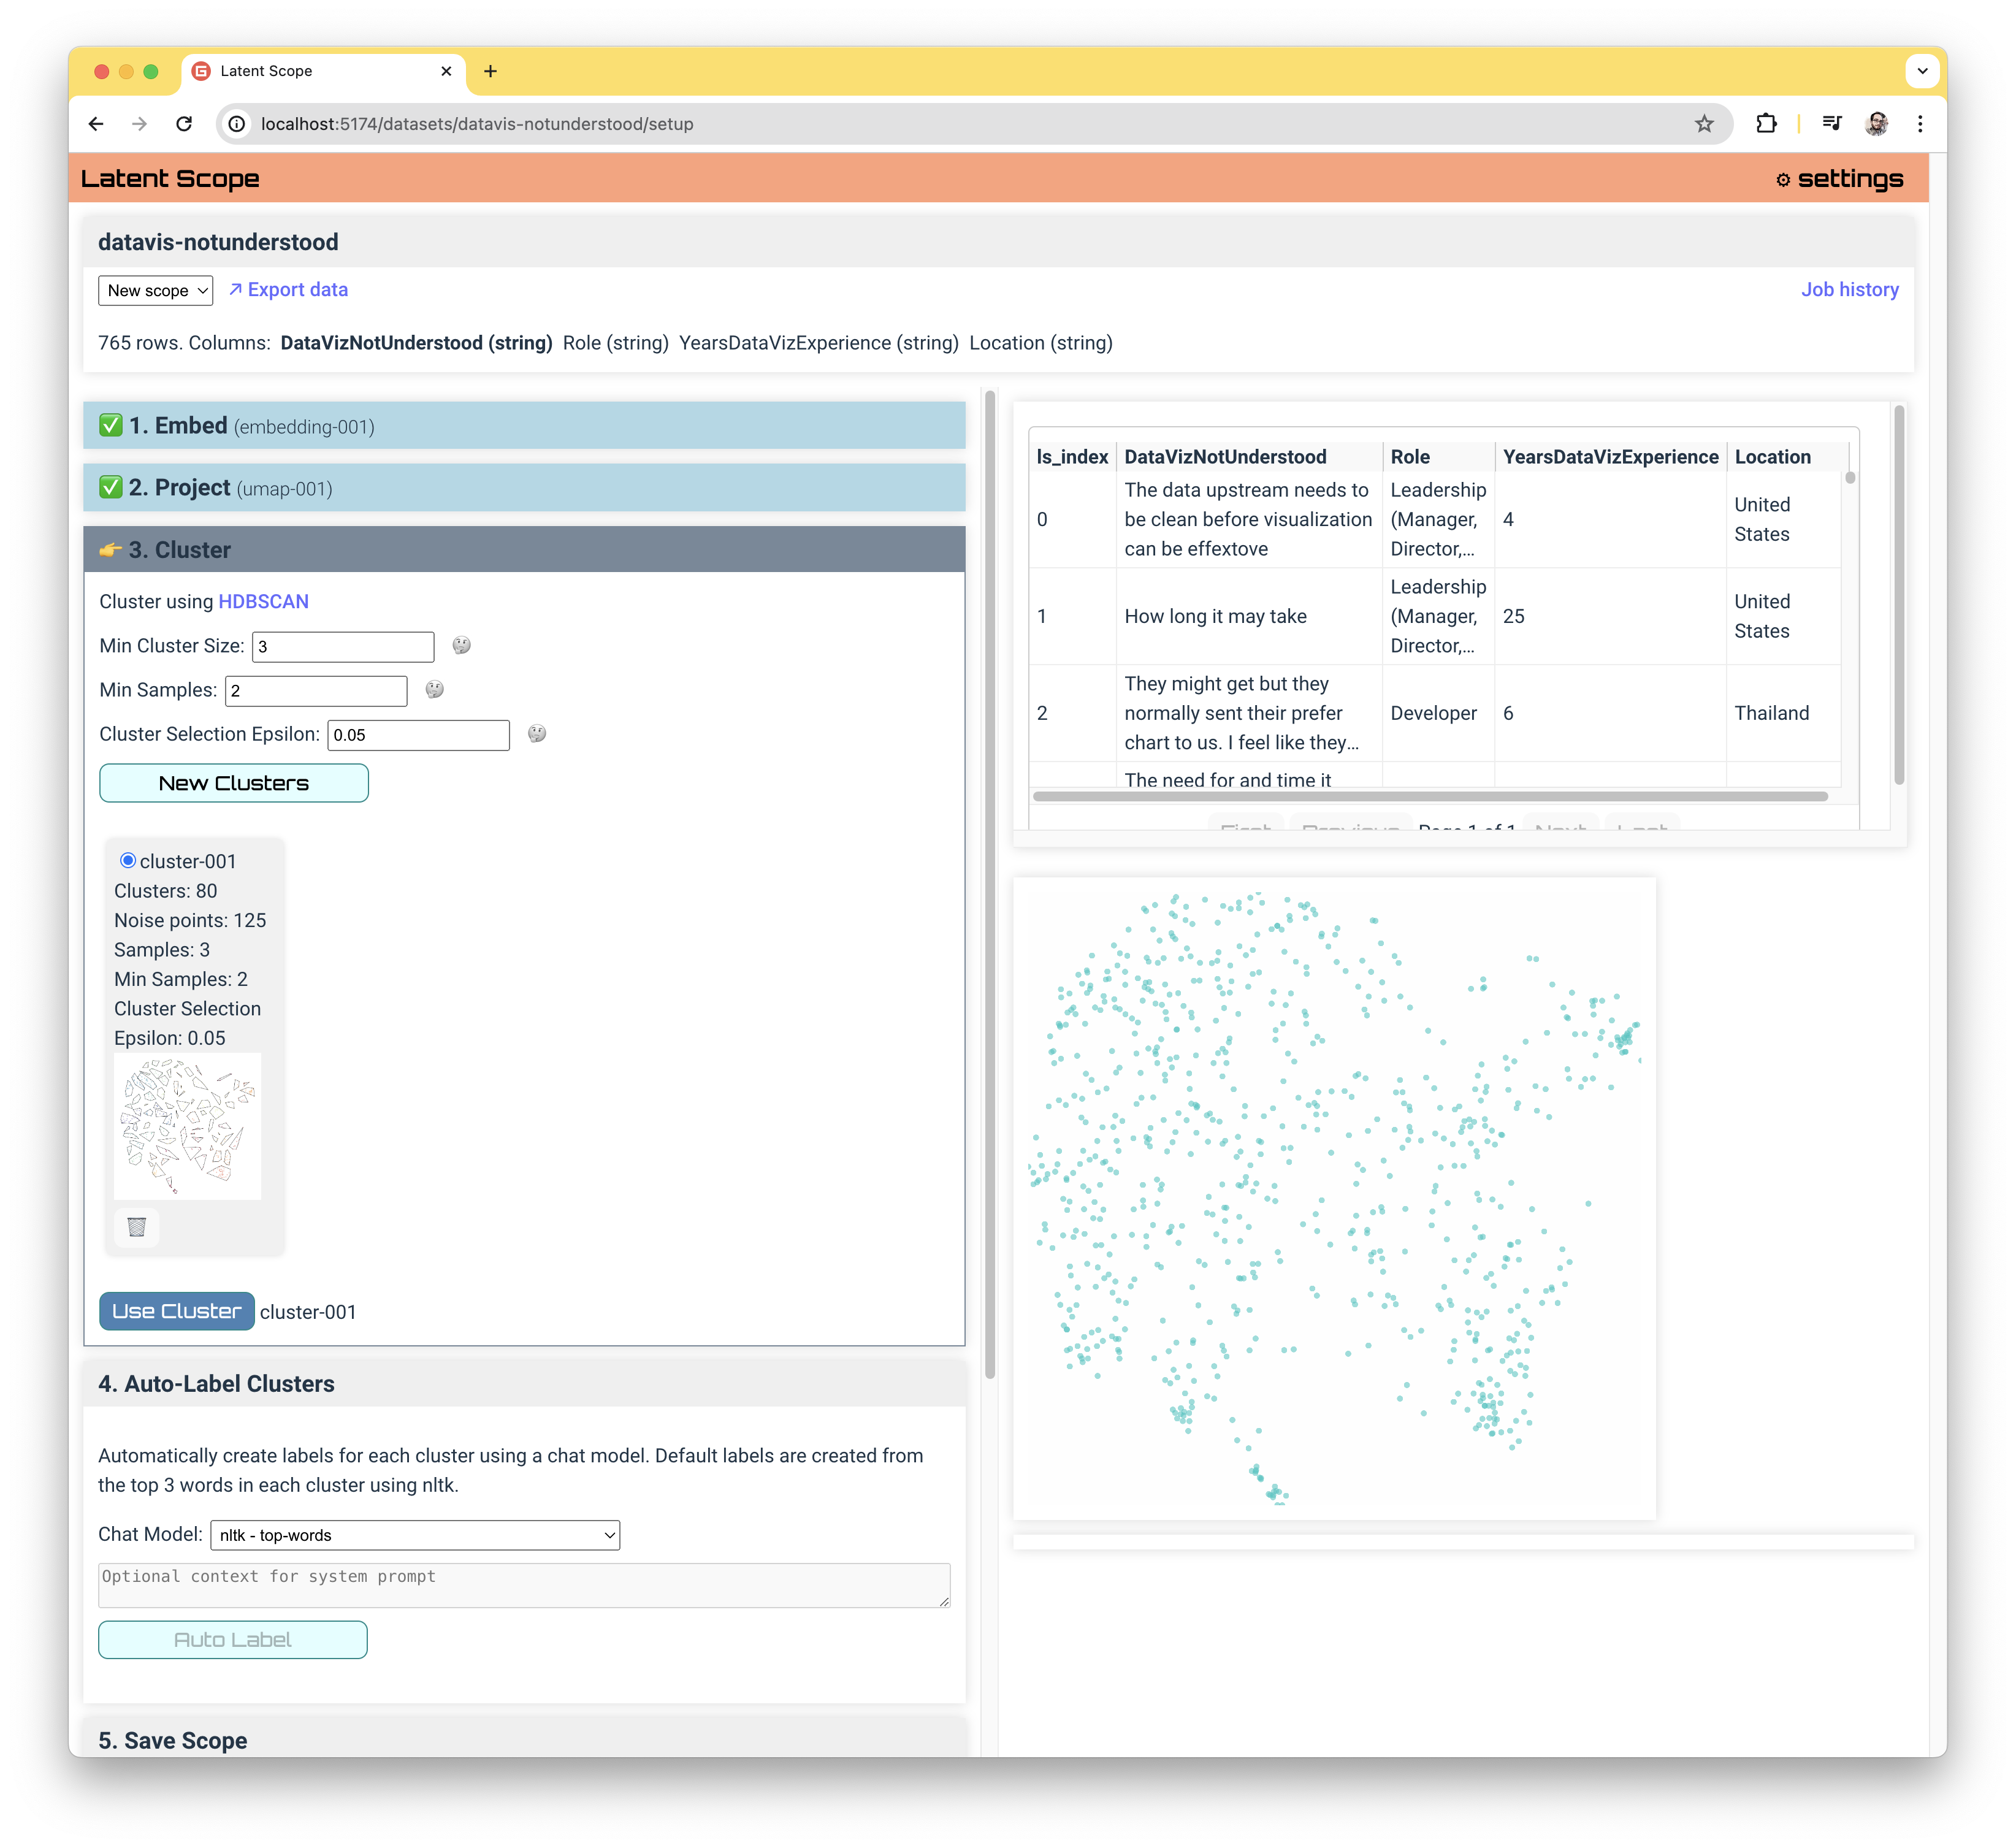
The next step is to group our points into clusters using HDBSCAN.
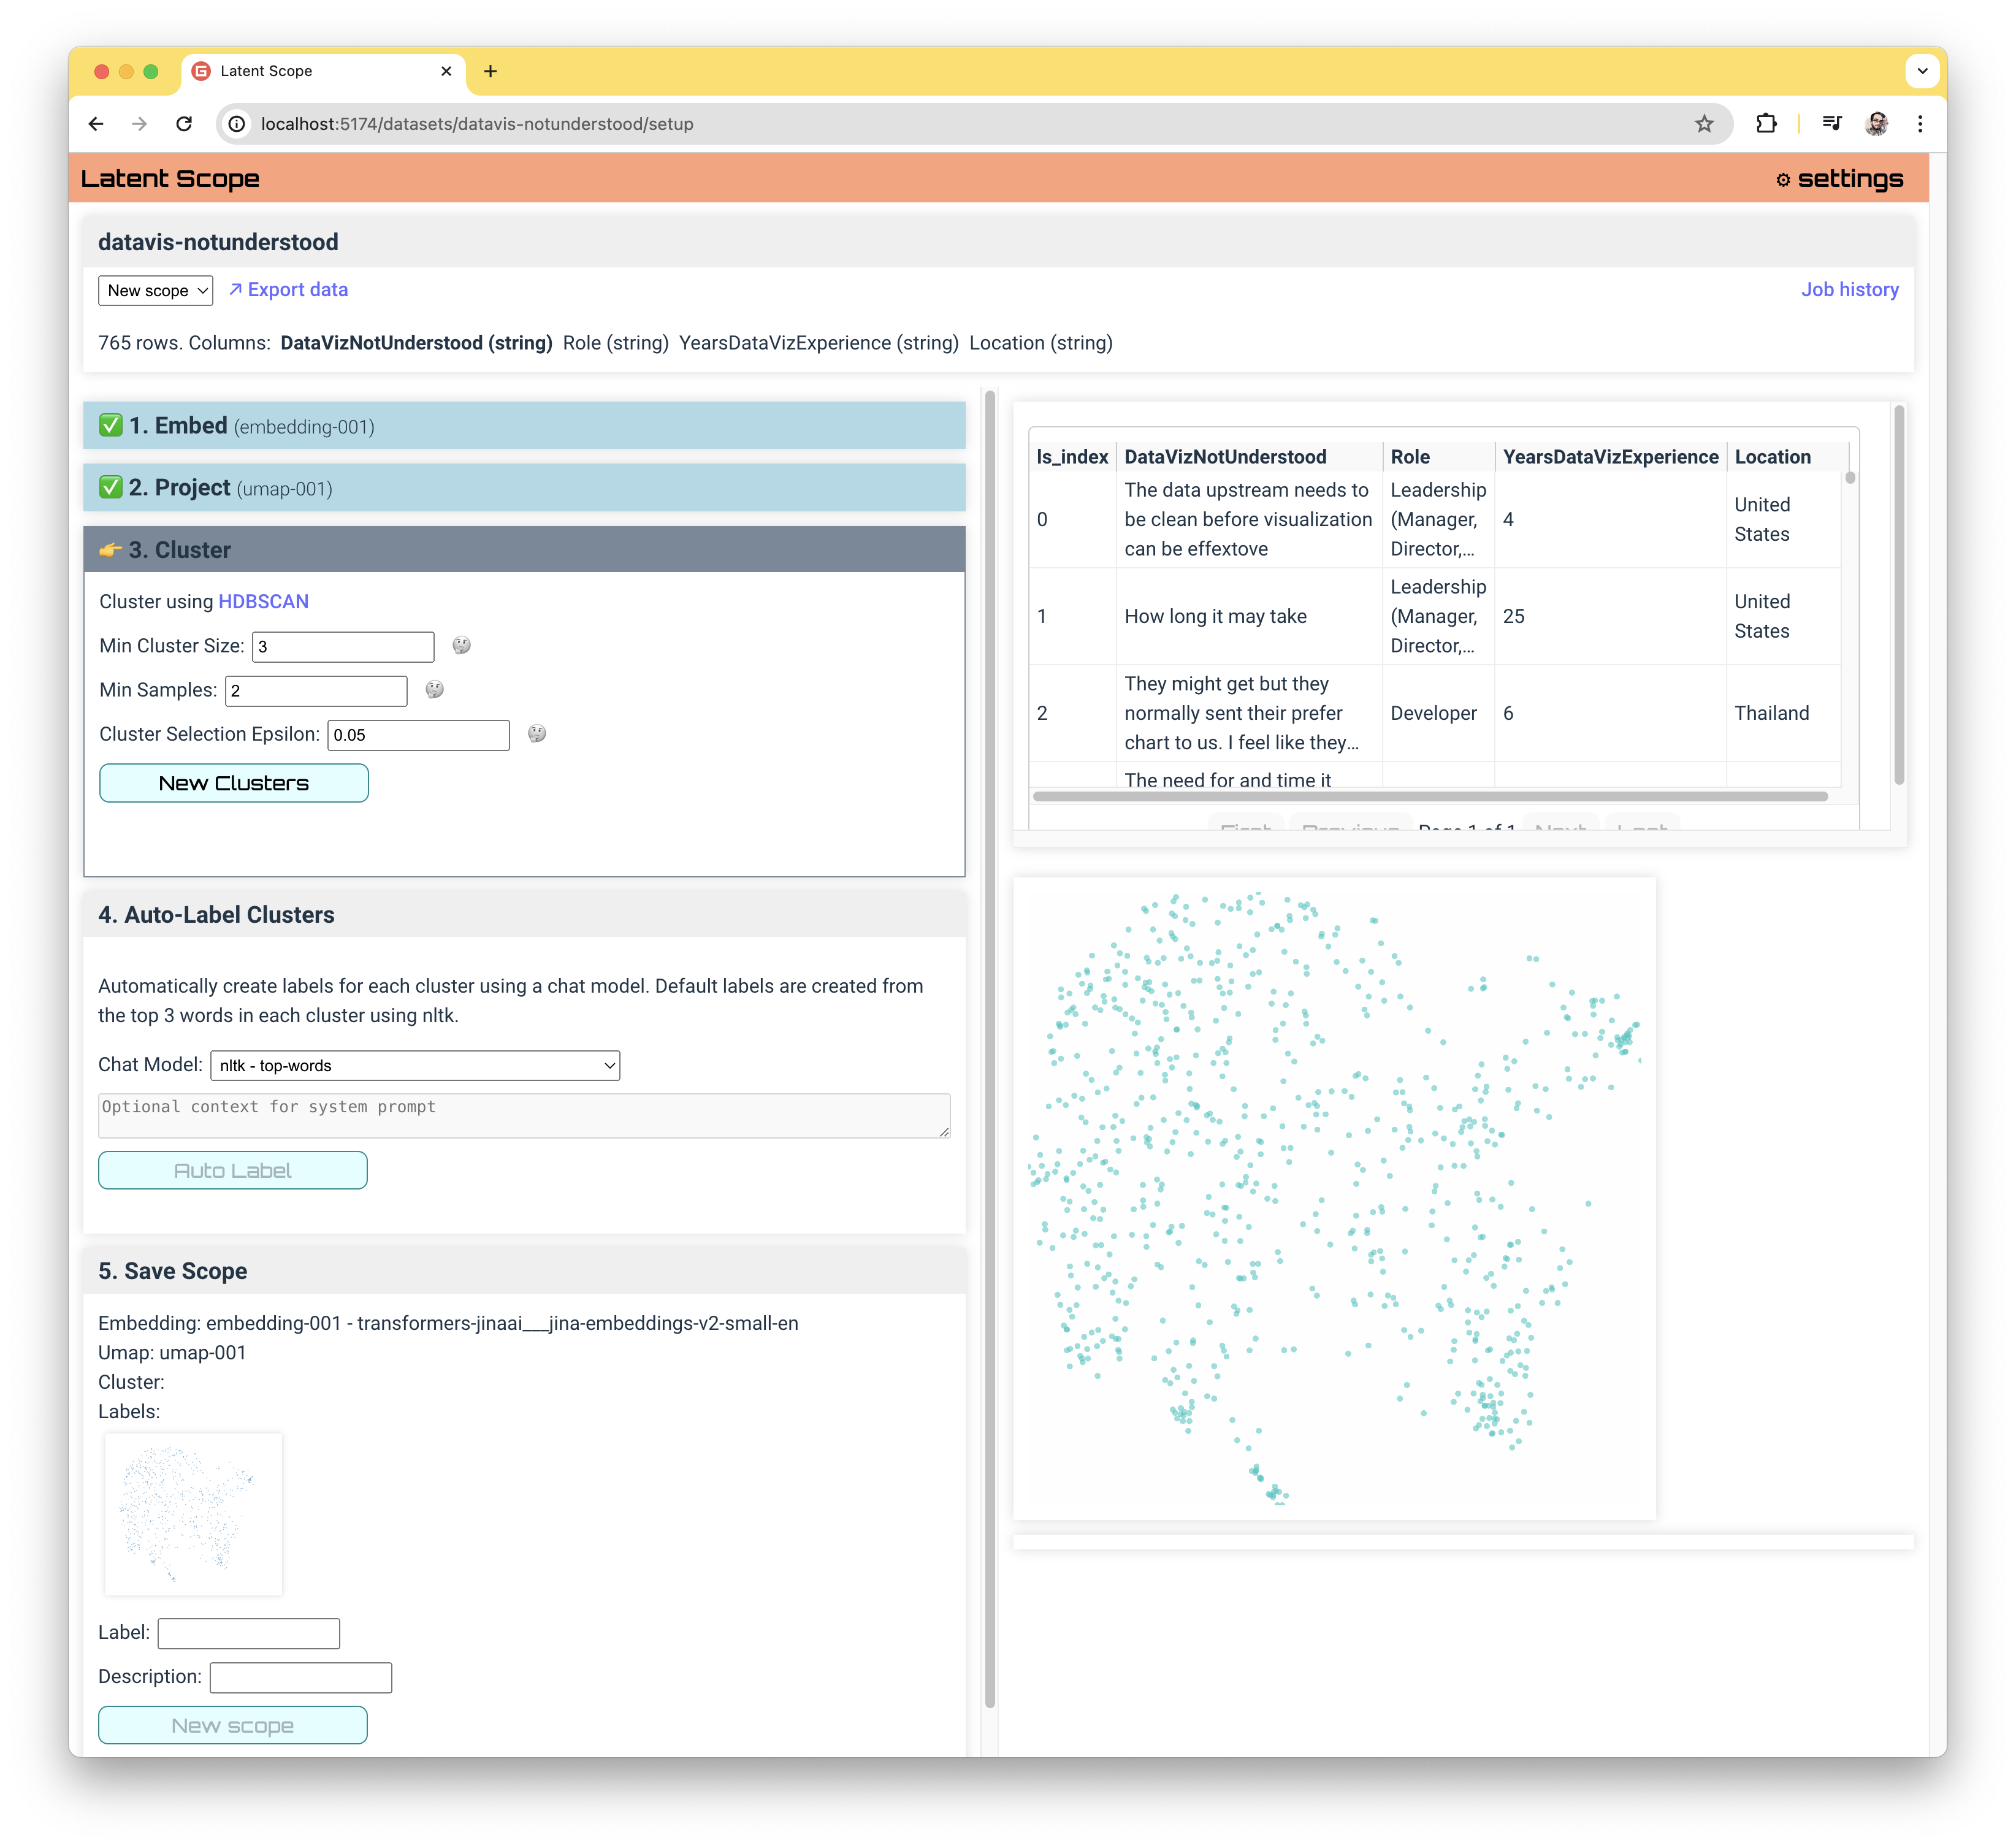
The default options are scaled to your dataset size, but may need to be tweaked to get a suitable number of clusters. I've found that keeping the Min Samples low (and sometimes shrinking the Cluster Selection Epsilon) can help increase the number of clusters if there are too few.
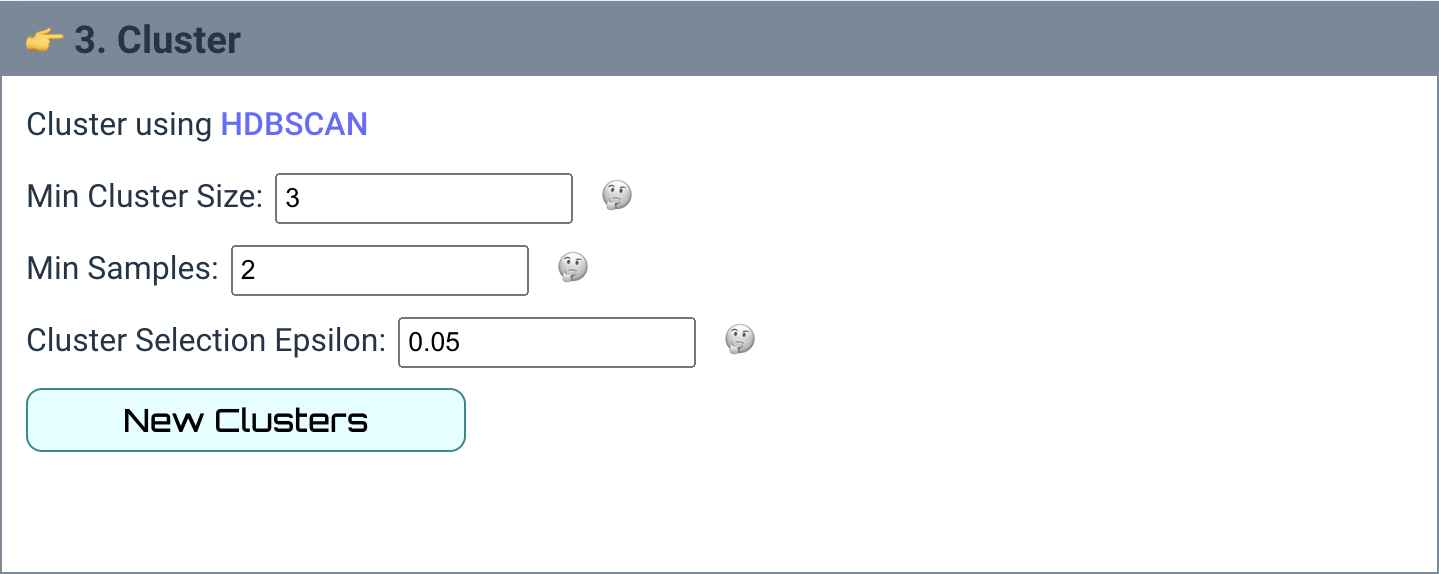
When you are happy with a clustering, click Use Cluster and move on to the last step!
Auto-Label Clusters
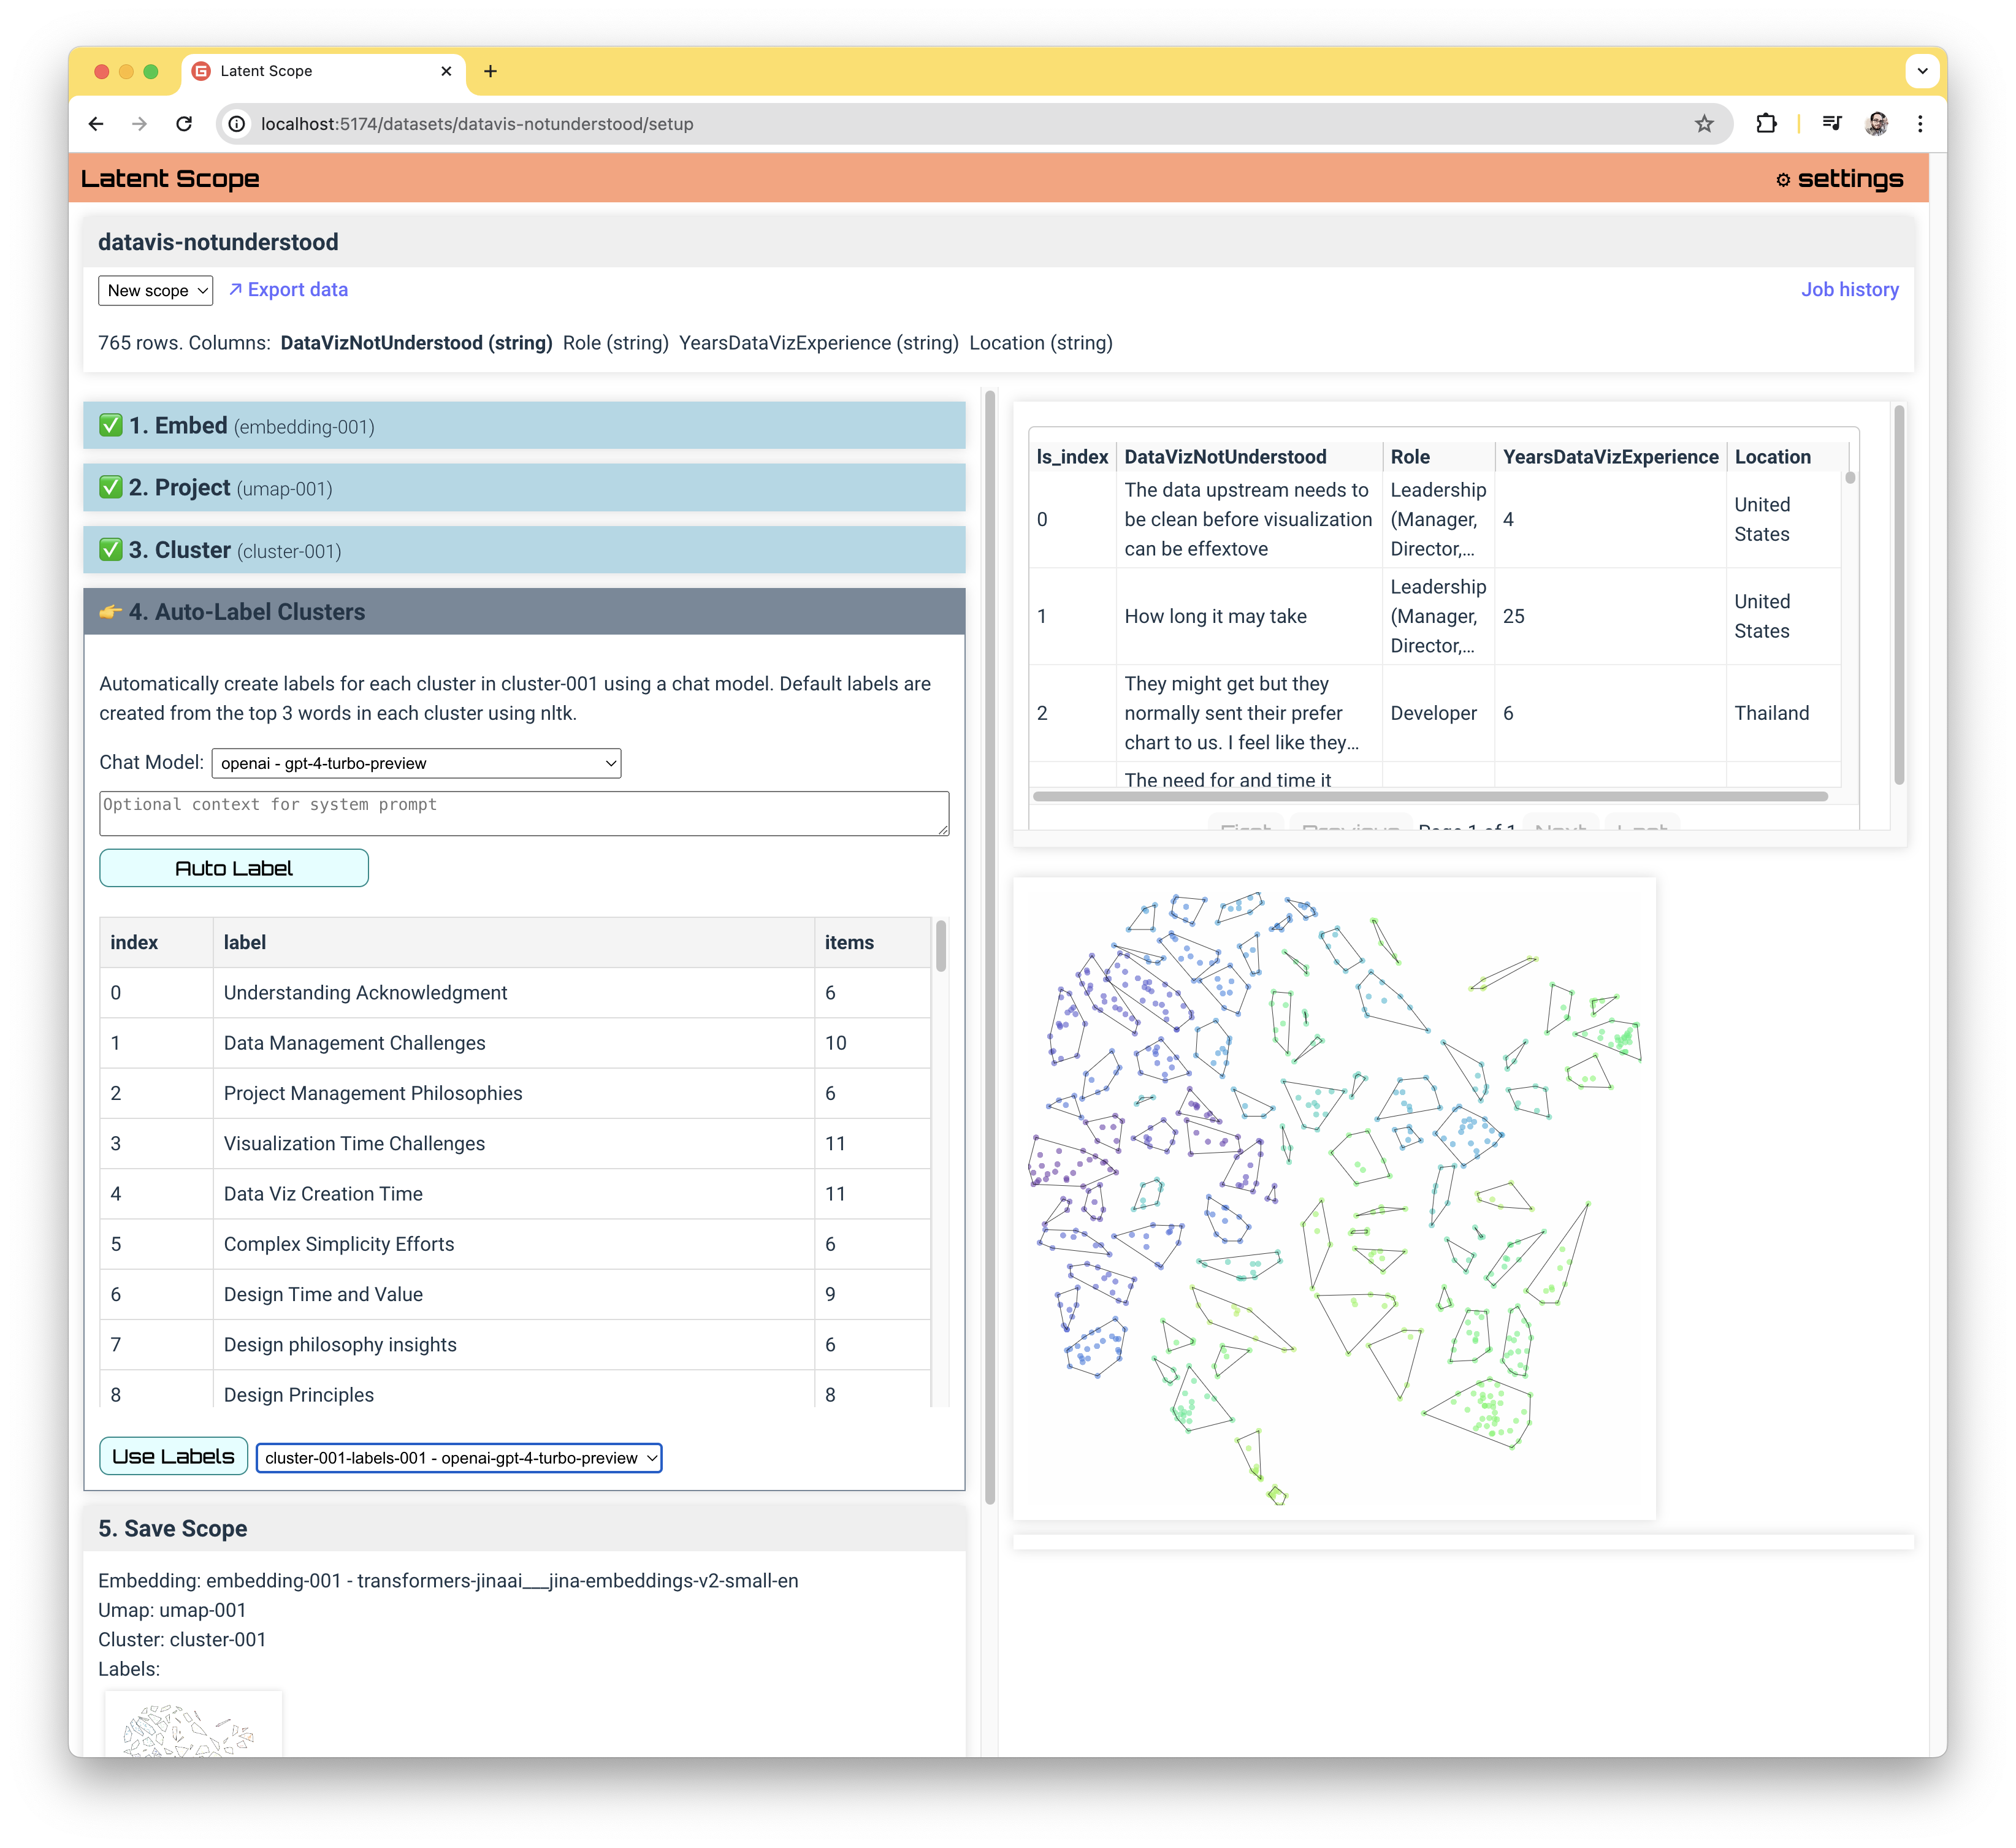
This last step can make a huge difference in the exploration and curation experience, especially for larger datasets with lots of clusters. The goal is to summarize each cluster based on a sampling of the entries that fall in that cluster.
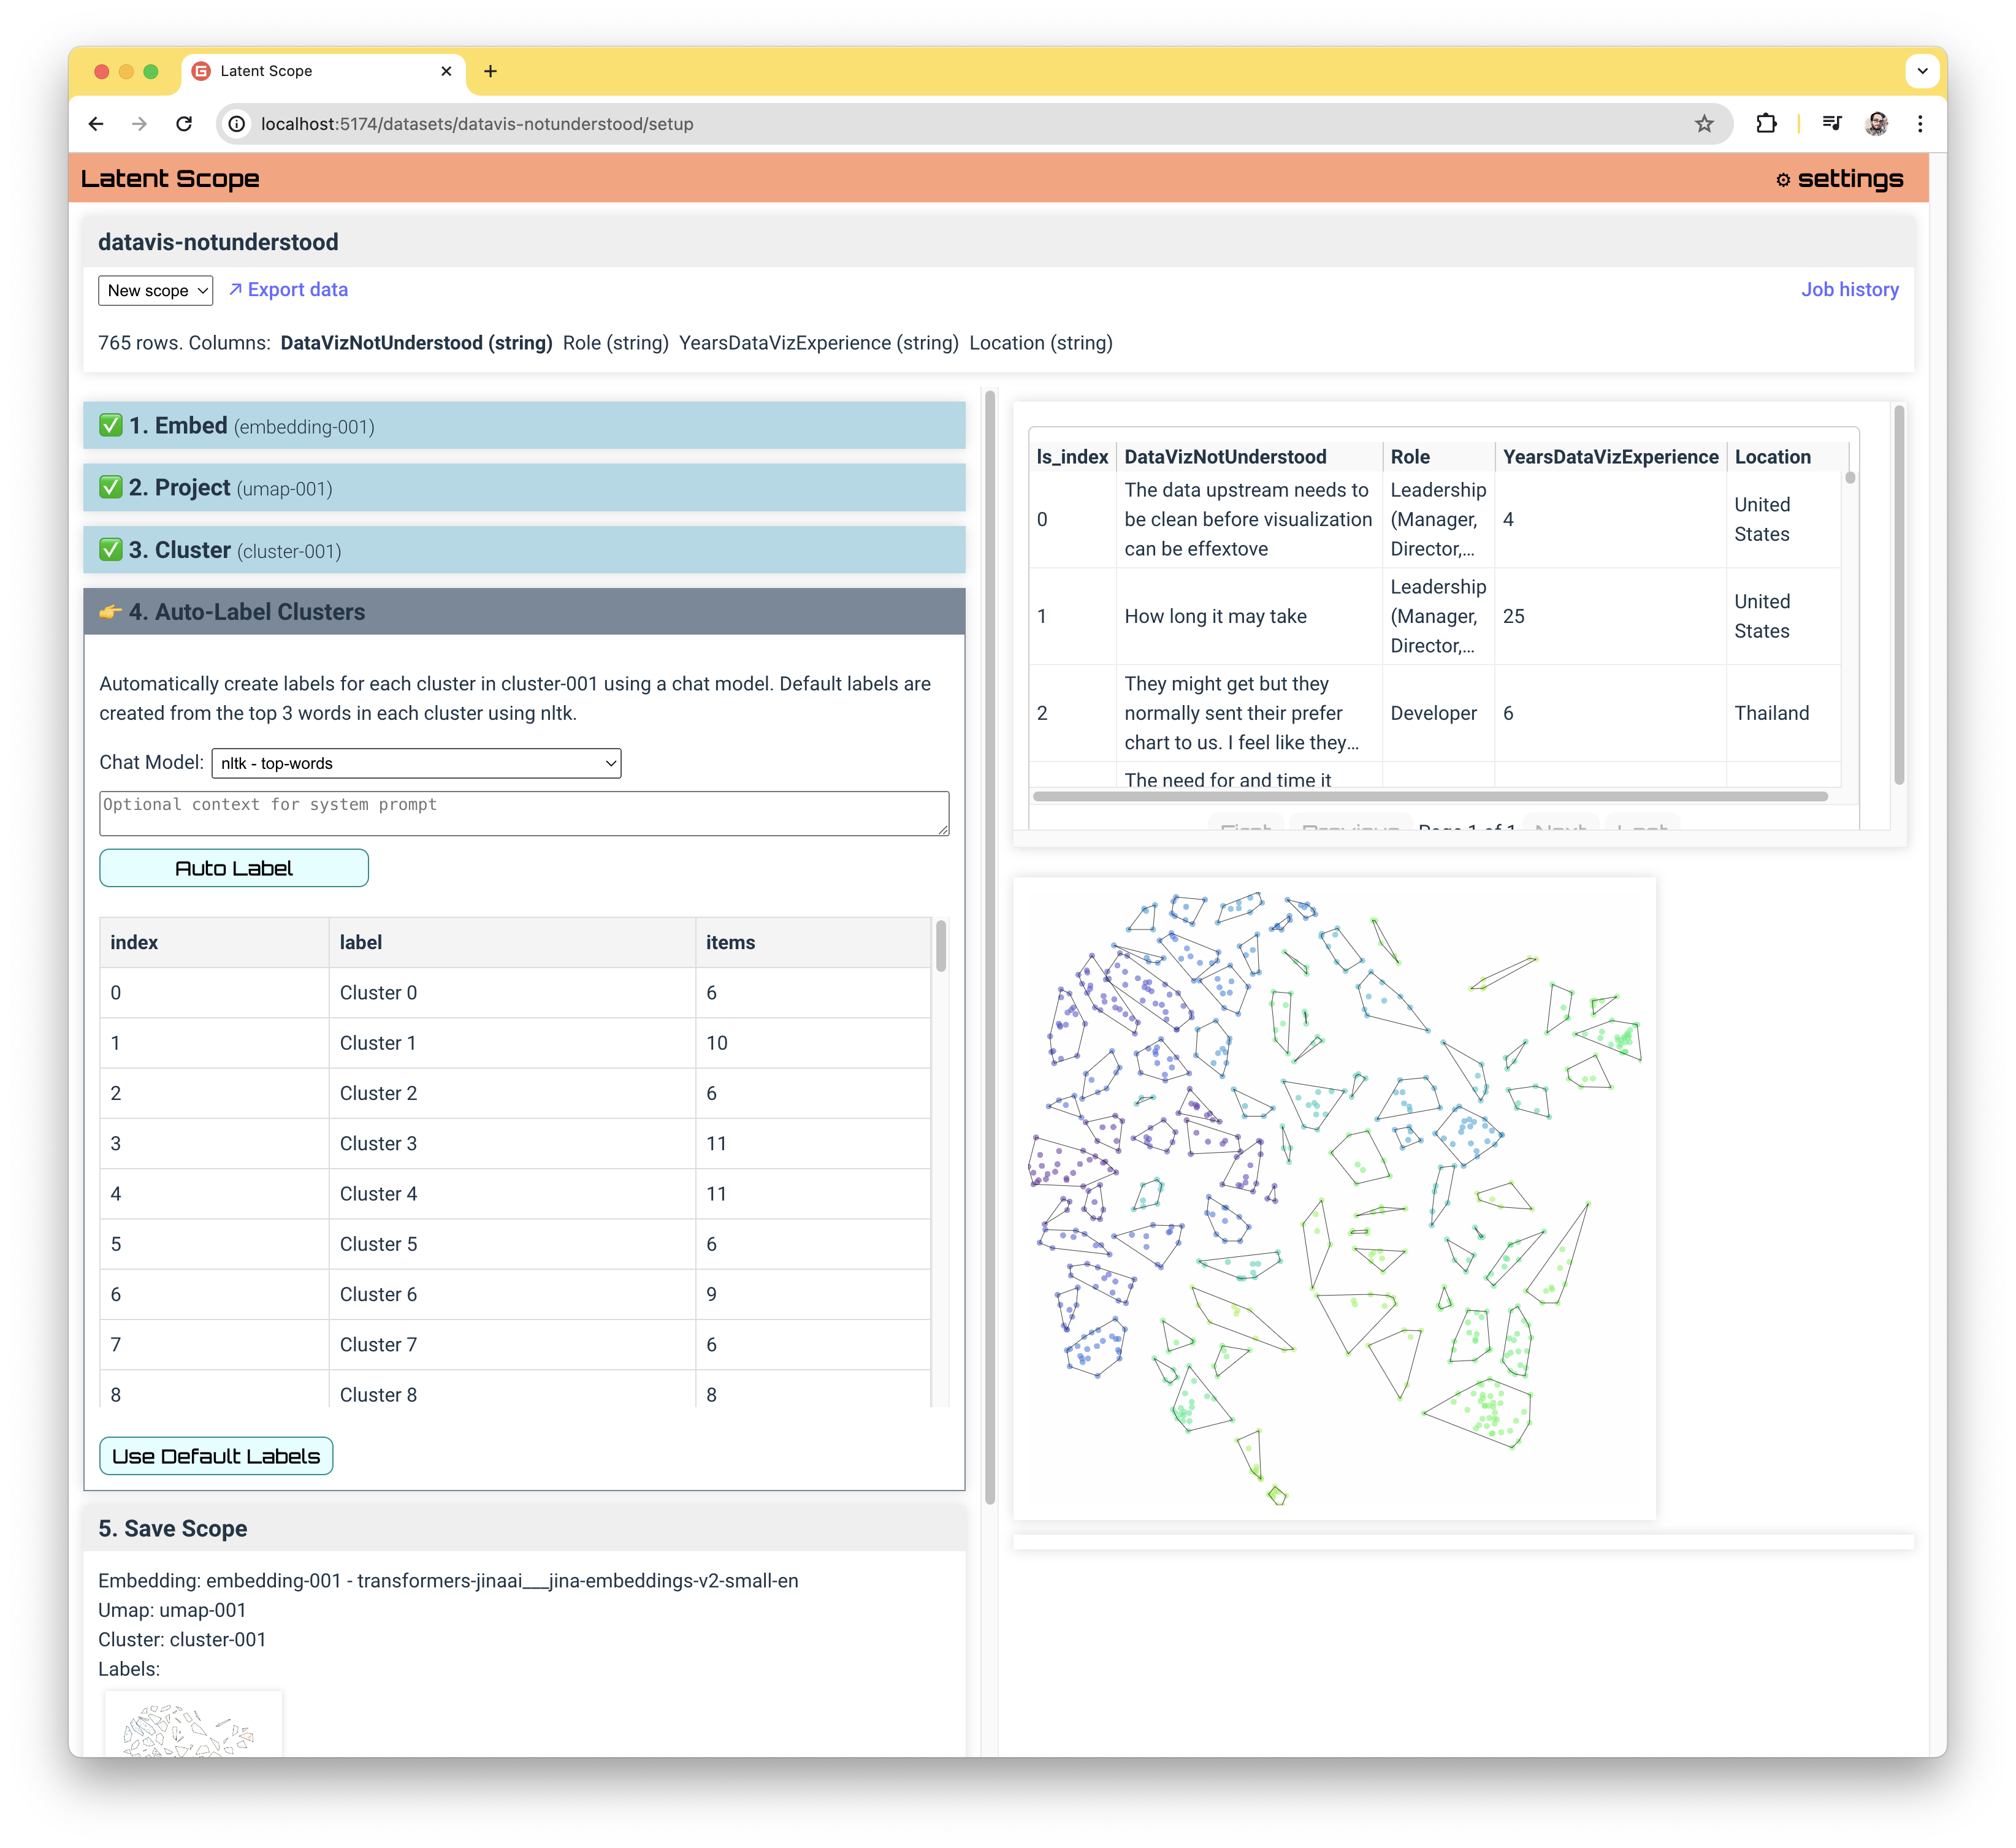
By default we just label each cluster with it's index, and if you want a very fast local CPU option you can use the nltk top-words method. Otherwise, you can choose from a short list of LLM providers to summarize your entries. See the Install & Configure section to add API keys for providers.
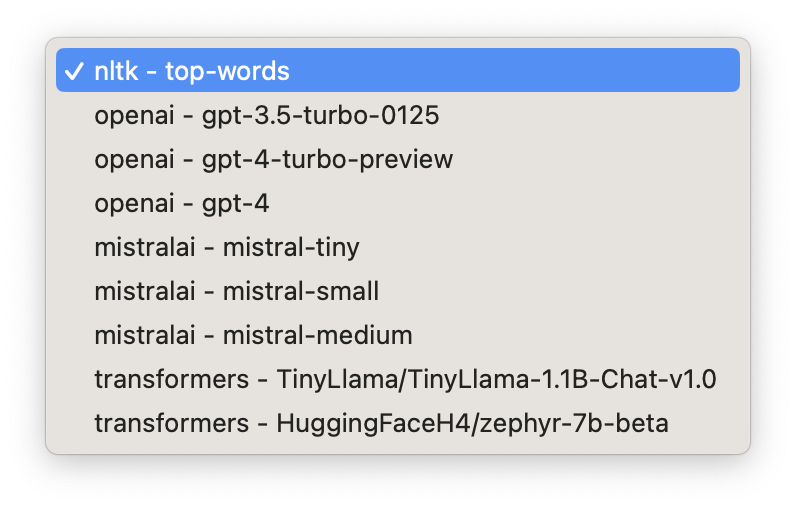
We are actively looking to add more LLM models and allow for custom endpoints. In our experience the larger the LLM the better it performs, so we recommend using a service until local LLMs get more powerful (next month?)
Save Scope
The final step is really just naming your scope and giving it an optional description. 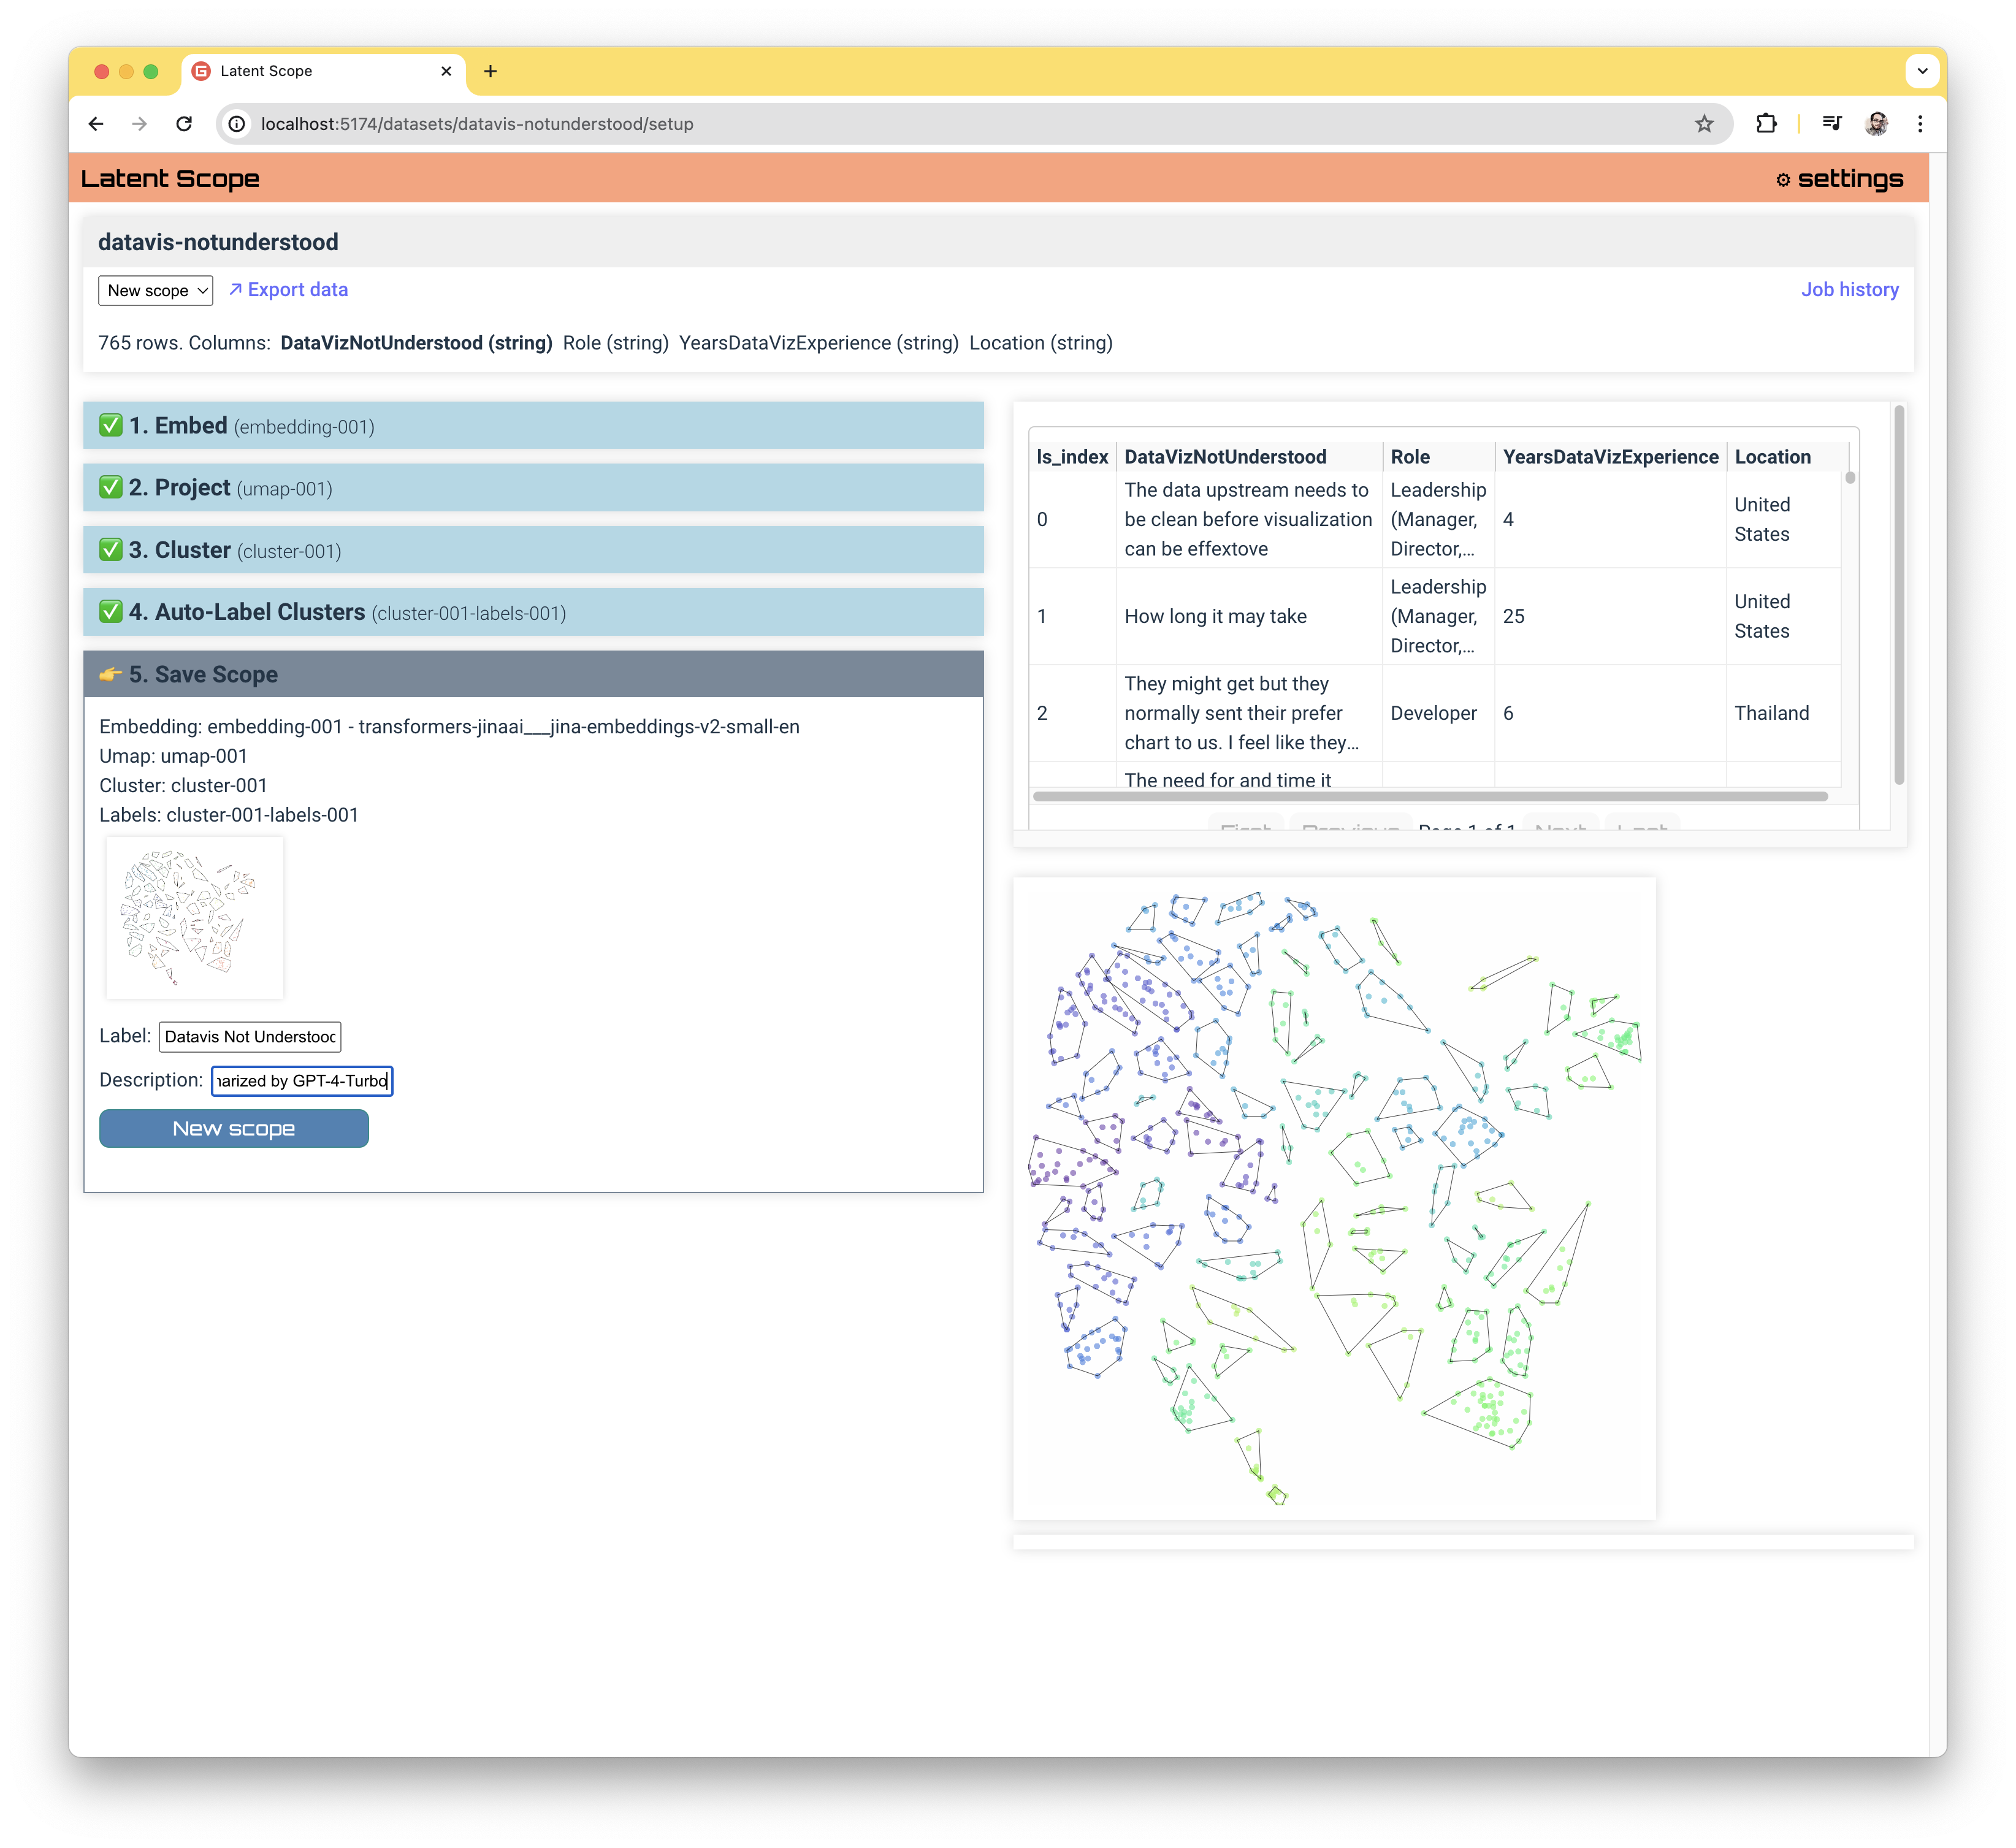
Click the New Scope button to save the scope and pull together all of the data generated via the process into a convenient format ready for Export or Exploration and Curation.

Hopefully you find a new perspective on your data!