data
Without data there can be no data visualization.
http://bit.ly/d3html5devconf
 results.forEach(function(d) {
d.evil = +d.evil;
d.passion = +d.passion;
d.age = +d.age || 0;
d.exp = +d.exp;
d.oj = d.oj.replace(/ /g, '-');
d.toothpaste = d.toothpaste.replace(/ /g, '-');
d.time = new Date(d.time);
})
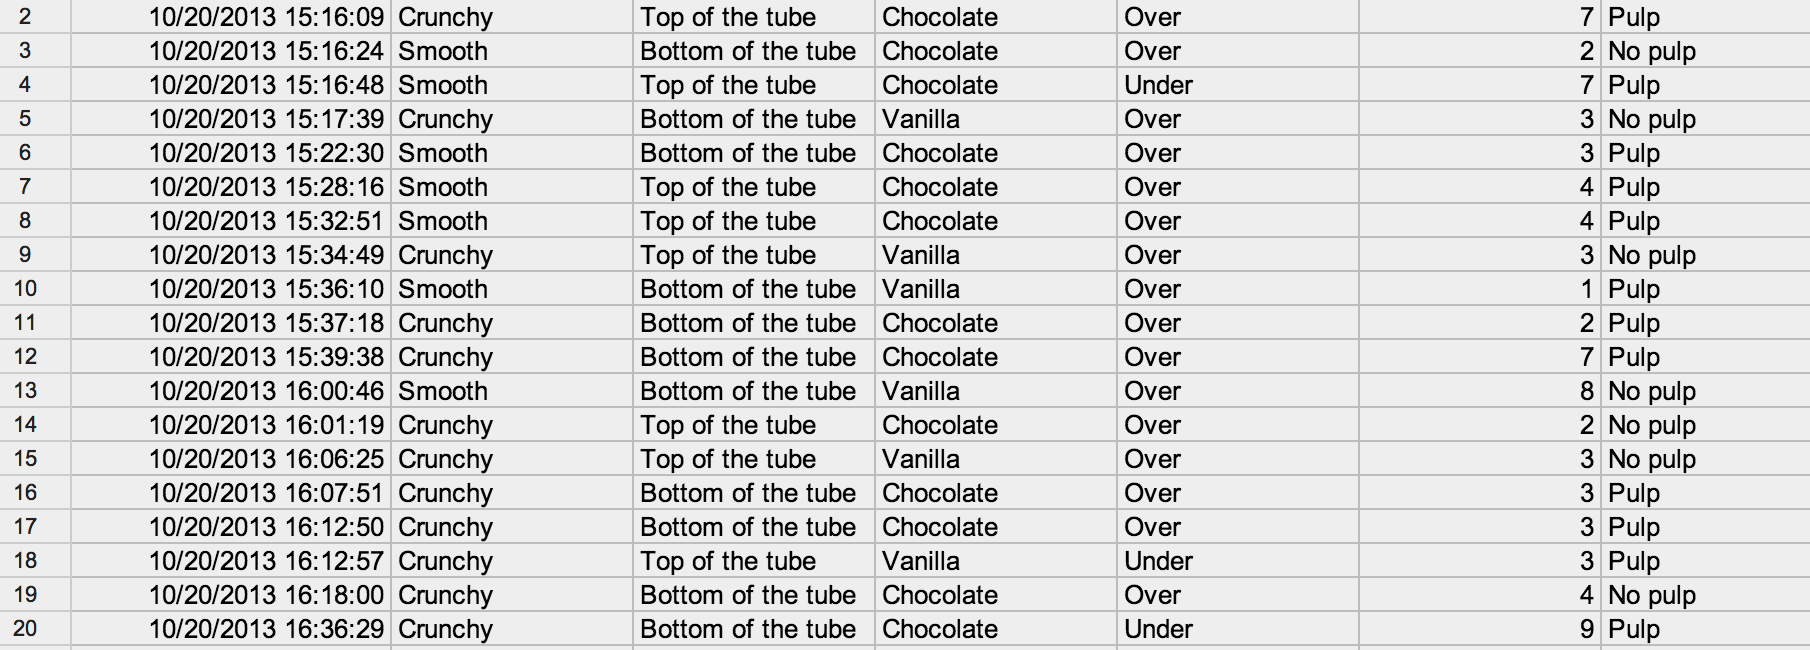
var qmap = {
time: {q: "Timestamp"},
pb: {q: "What type of peanut butter do you prefer?", a: ["Crunchy", "Smooth"]},
toothpaste: {q:"Where do you squeeze the toothpaste from?", a: ["Top", "Bottom"]},
cv: {q:"Vanilla or Chocolate?", a: ["Chocolate", "Vanilla"]},
tp: {q:"What direction does toilet paper go on the holder thingy?", a: ["Over", "Under"]},
oj: {q:"Do you prefer pulp or no pulp in your orange juice?", a: ["Pulp", "No-pulp"]},
evil: {q:"Where do you sit on the good vs. evil scale?"},
age: {q:"How old are you?"},
passion: {q:"How passionate of a person are you?"},
exp: {q:"How many years have you been building for the web?"}
}
//time,pb,toothpaste,cv,tp,oj,evil,passion,exp,age
Tributary Starter pack
results.forEach(function(d) {
d.evil = +d.evil;
d.passion = +d.passion;
d.age = +d.age || 0;
d.exp = +d.exp;
d.oj = d.oj.replace(/ /g, '-');
d.toothpaste = d.toothpaste.replace(/ /g, '-');
d.time = new Date(d.time);
})
var qmap = {
time: {q: "Timestamp"},
pb: {q: "What type of peanut butter do you prefer?", a: ["Crunchy", "Smooth"]},
toothpaste: {q:"Where do you squeeze the toothpaste from?", a: ["Top", "Bottom"]},
cv: {q:"Vanilla or Chocolate?", a: ["Chocolate", "Vanilla"]},
tp: {q:"What direction does toilet paper go on the holder thingy?", a: ["Over", "Under"]},
oj: {q:"Do you prefer pulp or no pulp in your orange juice?", a: ["Pulp", "No-pulp"]},
evil: {q:"Where do you sit on the good vs. evil scale?"},
age: {q:"How old are you?"},
passion: {q:"How passionate of a person are you?"},
exp: {q:"How many years have you been building for the web?"}
}
//time,pb,toothpaste,cv,tp,oj,evil,passion,exp,age
Tributary Starter pack
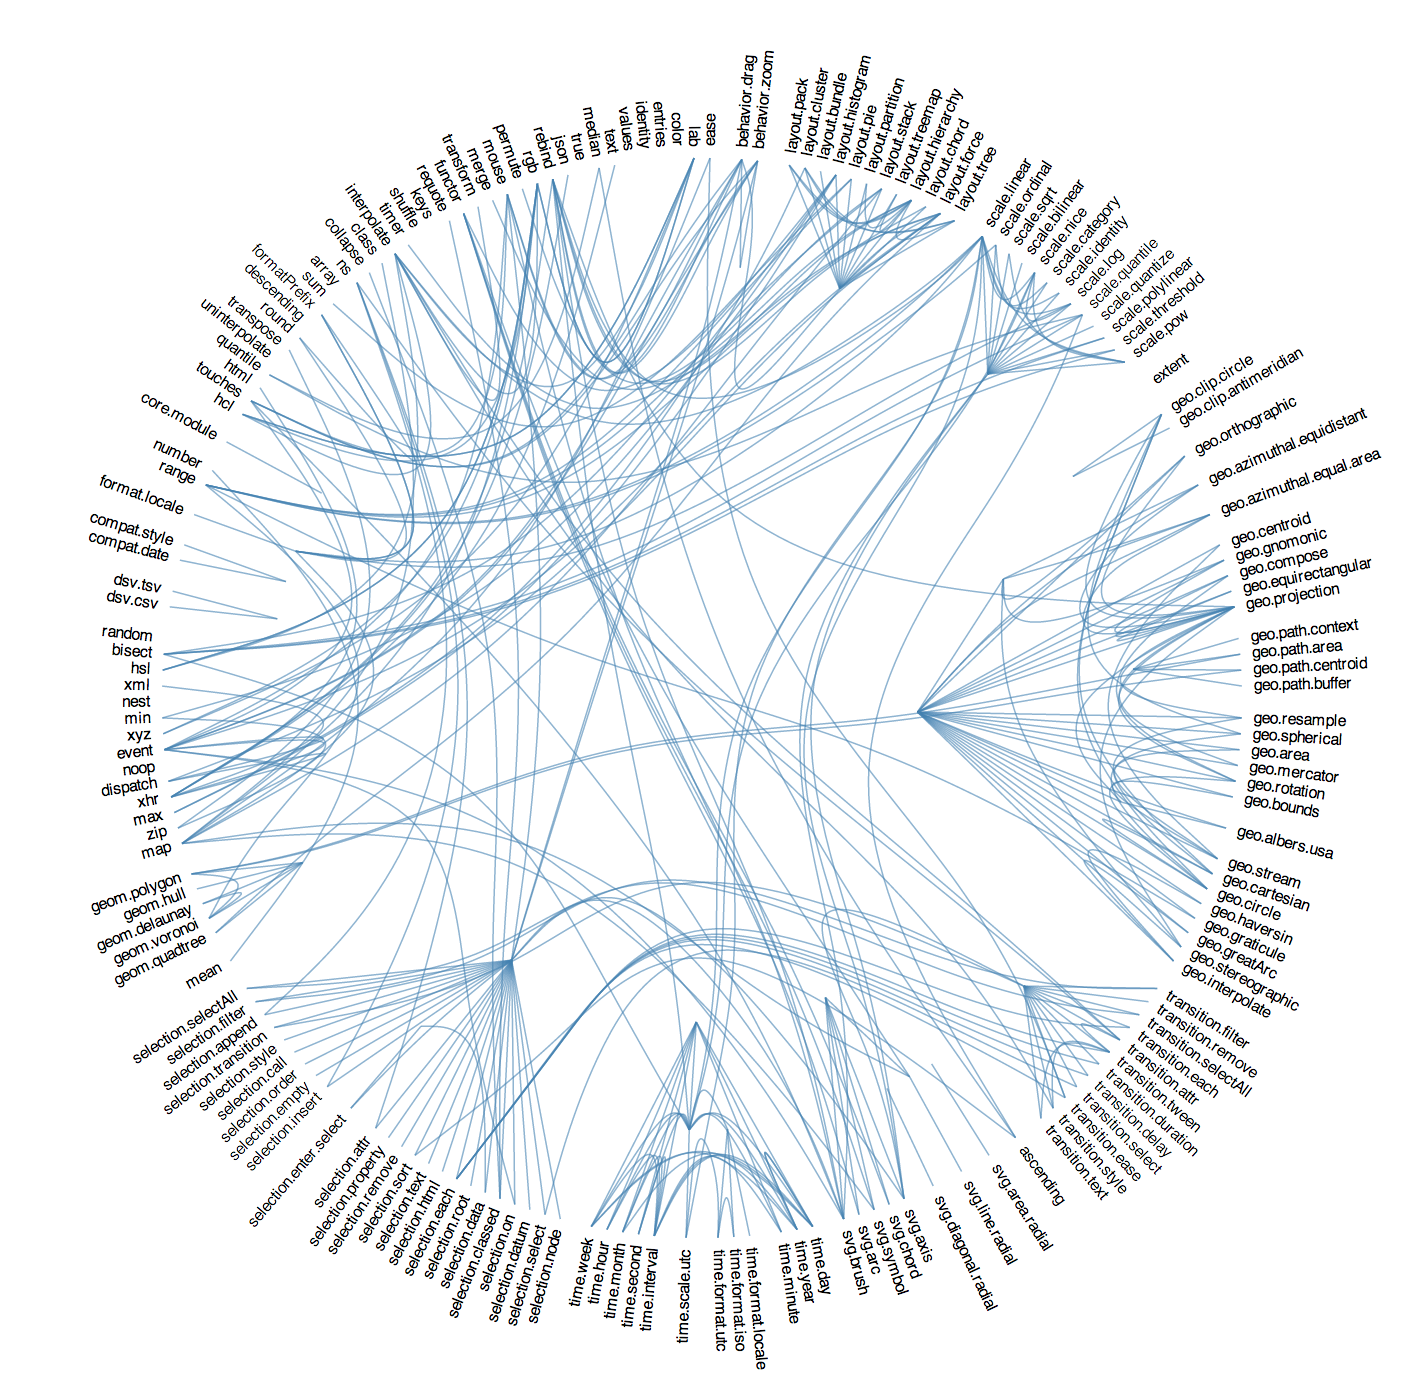
d3
d3.js is a visualization toolkit.
Alchemy
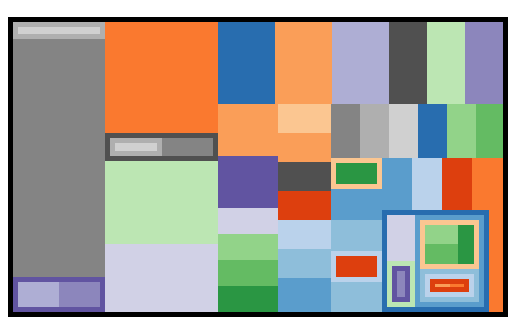
Binding data to DOM elements
var ppl = display.selectAll("div.person")
.data(results)
ppl.enter()
.append("div").classed("person", true)
ppl.style({
width: "20px",
height: "20px",
float: "left",
margin: "2px",
"background-color": "#26BD7A"
})
Tributary Example
scales
Doh ray me fah sooooo.
var colorScale = d3.scale.ordinal()
.domain(["Crunchy", "Smooth"])
.range(["#fff", "#000"])
Tributary Example
var linearScale = d3.scale.linear()
.domain([1, 10])
.range([0, 400])
Tributary Example
generators
Abracadabra.
var format = d3.time.format("%m/%d %H:%M")
var axis = d3.svg.axis()
.scale(timeScale)
.orient("bottom") //left, right, top
.ticks(5) //best guess
.tickFormat(format)
//.tickValues([20, 25, 30]) //specify exact values
var g = svg.append("g")
axis(g)
g.attr("transform", "translate(100, 600)")
g.selectAll("path")
.style({ fill: "none", stroke: "#000"})
g.selectAll("line")
.style({ stroke: "#000"})
Axes
Tributary Example
var scale = d3.scale.linear()
.domain([20, 30])
.range([10, 300])
var brush = d3.svg.brush()
brush.x(scale)
brush.extent([22, 28])
var g = svg.append("g")
brush(g)
g.attr("transform", "translate(50, 100)")
g.selectAll("rect").attr("height", 30)
g.selectAll(".background")
.style({fill: "#4B9E9E", visibility: "visible"})
g.selectAll(".extent")
.style({fill: "#78C5C5", visibility: "visible"})
g.selectAll(".resize rect")
.style({fill: "#276C86", visibility: "visible"})
Brush
Tributary Example
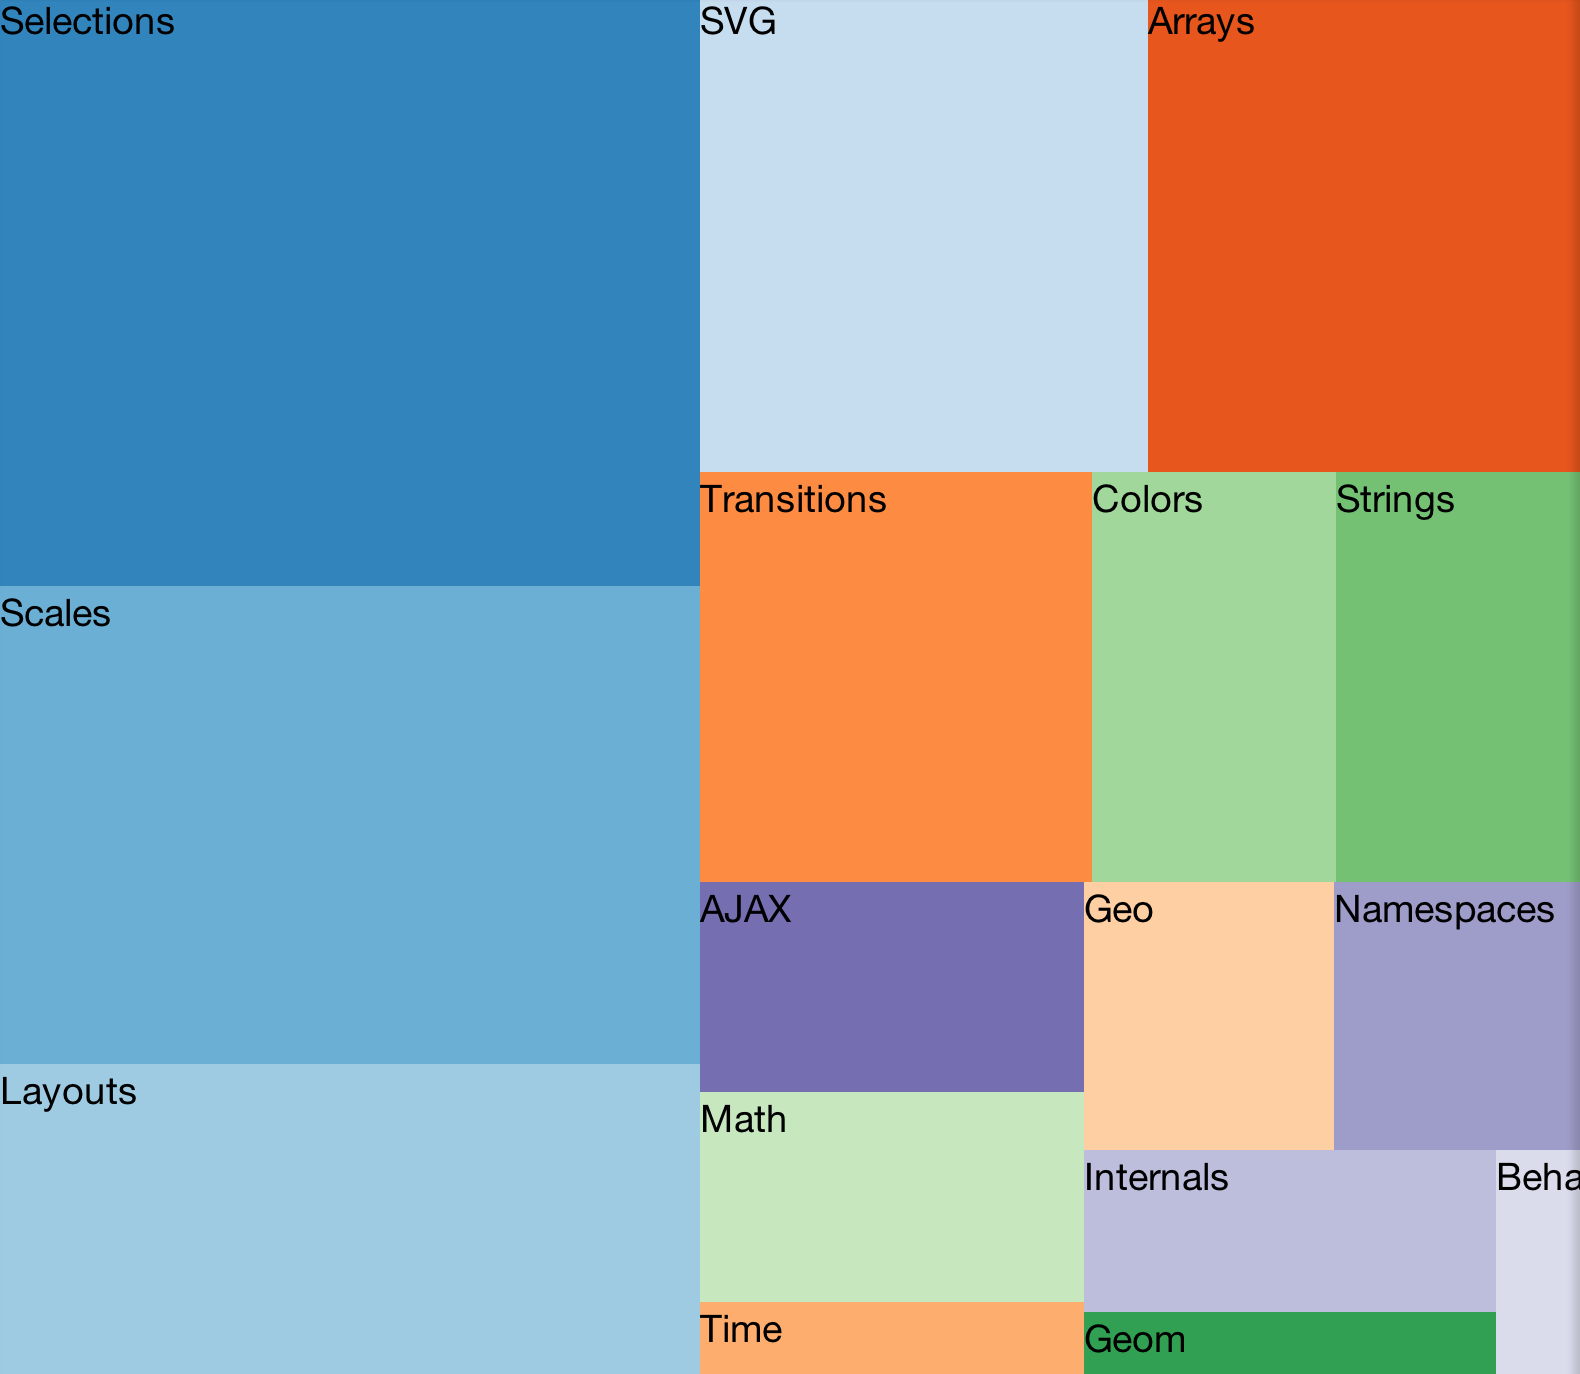
layouts
The force is with you.
var force = d3.layout.force()
.charge(0)
.nodes(results)
.size([700, 700])
force.on("tick", function(e) {
var q = d3.geom.quadtree(results);
results.forEach(function(d) { q.visit(collide(d)) });
var k = 0.1 * e.alpha;
svg.selectAll("circle")
.attr({
cx: function(d) {
return d.x += (xScale(d.passion) - d.x) * k;
},
cy: function(d) {
return d.y += (yScale(d.evil) - d.y) * k;
}
})
});
force.start();
function collide(node) {
var r = node.radius + 10,
nx1 = node.x - r,
nx2 = node.x + r,
ny1 = node.y - r,
ny2 = node.y + r;
return function(quad, x1, y1, x2, y2) {
if (quad.point && (quad.point !== node)) {
var x = node.x - quad.point.x,
y = node.y - quad.point.y,
l = Math.sqrt(x * x + y * y),
r = node.radius + quad.point.radius;
if (l < r) {
l = (l - r) / l * .5;
node.x -= x *= l;
node.y -= y *= l;
quad.point.x += x;
quad.point.y += y;
}
}
return x1 > nx2 || x2 < nx1 || y1 > ny2 || y2 < ny1;
};
}
Tributary Example
legend
Iconic.
var questions = [
"pb", "toothpaste", "cv", "tp", "oj"
]
var stickers = {};
questions.forEach(function(q) {
var answer = qmap[q].a[0];
stickers[answer] = d3.sticker("#" + answer);
answer = qmap[q].a[1];
stickers[answer] = d3.sticker("#" + answer);
})
Tributary Example
d3.selectAll(".CodeMirror-scroll").style({"font-size": "22px", "line-height": "22px"})
Top