
- Developing Latent Scope, an open-source tool for exploring unstructured data.
- Building cutting edge data interfaces for industry leading research teams.

- Developed data-driven tools supporting 300+ person design team.
- Open-sourced 50 million Quick, Draw drawings with the Creative Lab
- Co-authored 4 publications on Distill.
Distill was a scientific journal for publishing interactive Machine learning research.
While at Google I co-authored:

At Google I helped the Creative Lab open source the Quick, Draw! dataset.
This data was used to:
- Write up an Introduction to the Quick, Draw! Dataset
- Work with Google Brain to demo the SketchRNN model.
- Give a talk at OpenVisConf about Machine Learning for Visualization
I love collecting, exploring and visualizing data!
A selection of datasets I am proud of:
- Observable Curated Datasets
- Wildfire data
- Air quality data
- Emoji data
- COVID data
- Election data
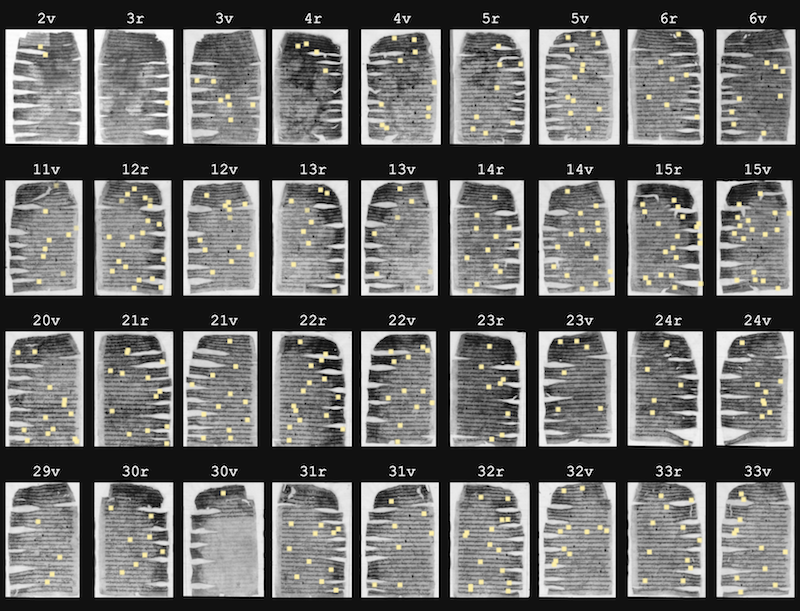
- Medieval manuscript punctuation data (in collaboration with my father)
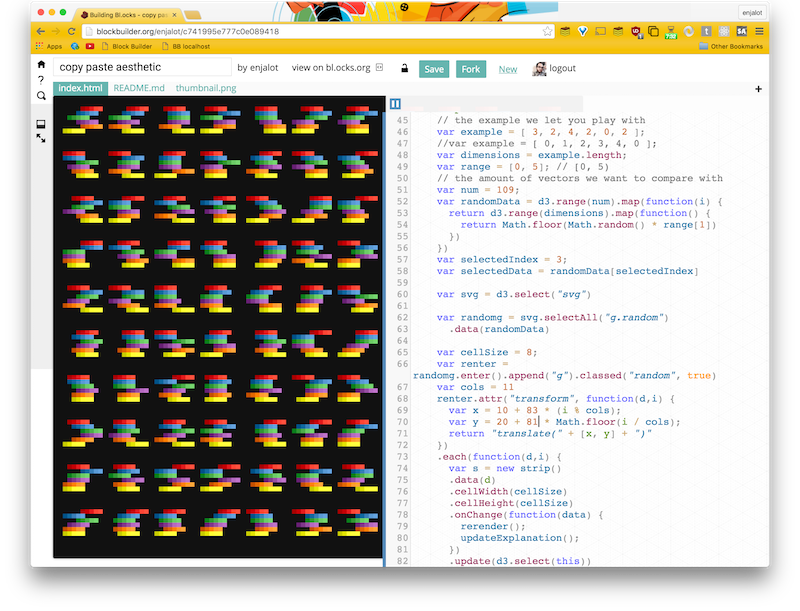
Block Builder was an in-browser editor for quickly making, editing, remixing and sharing d3.js code examples. Launched via Kickstarter it supported the curation of more than 40,000 community examples.
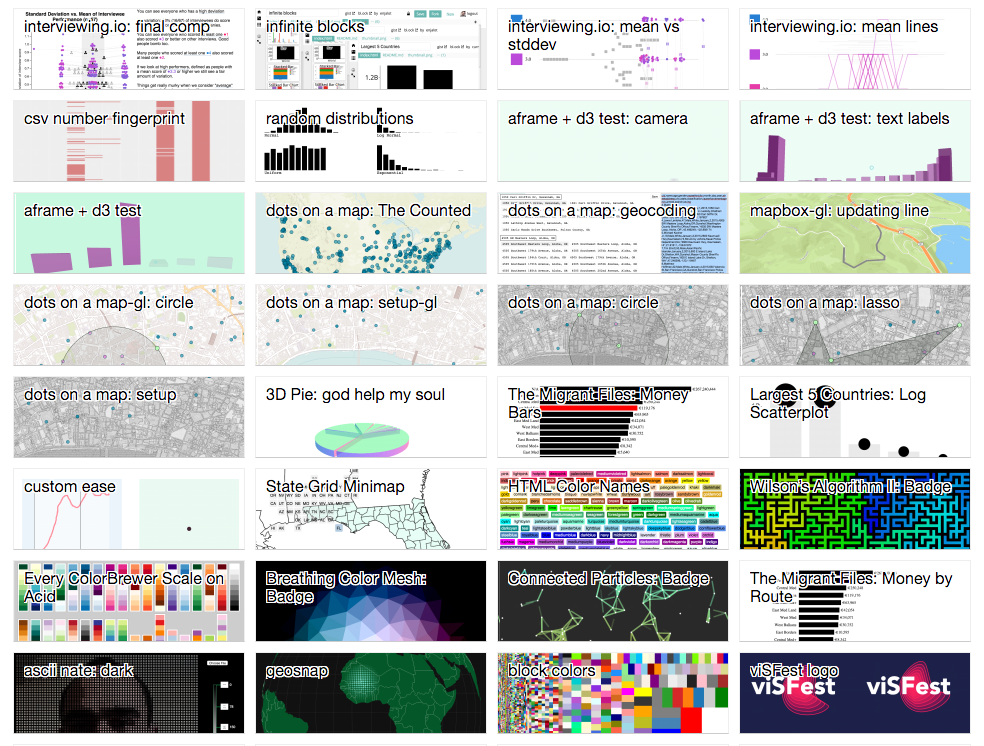
Part of my process is building and sharing small experiments. I've got hundreds of d3.js blocks, Observable notebooks and collaborations demonstrating various data visualization, UX and graphics techniques.

Co-founded and co-organized the Bay Area d3.js meetup in 2012 which has grown to 5,000+ members in person and 9,000+ online. Wrote several popular articles on D3 including:
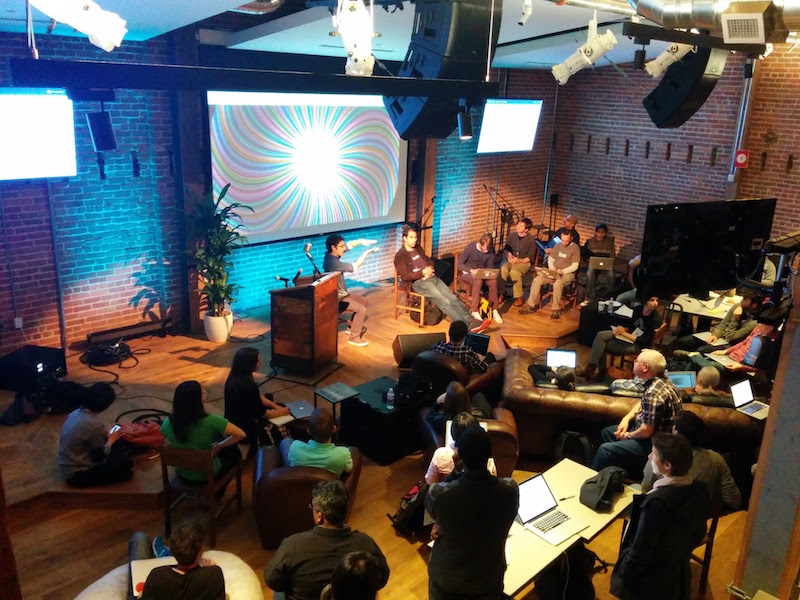
Co-founded and co-organized the d3.js unconference for 5 years. Each year a 100+ top d3.js practitioners gathered to discuss, learn and advance d3.js together.

I like to share my understanding on YouTube I've published more than covering various aspects of d3, data visualization, web cartography and graphics programming.

Produced, organized and hosted numerous events, workshops and live streams for the Observable Community.

